


Key performance indicators (KPIs) are a special kind of metric that tells us if we’re headed toward the thrill of victory or at risk of feeling the agony of defeat. The KPIs a team selects for a project or campaign shape its priorities and execution. Select the wrong success indicators, and your projects can veer off track. How do email marketers choose the right KPIs and use these metrics to go for the gold? Find out in this ultimate guide to email marketing KPIs.
What do elite athletes and email marketers have in common?
No, it’s not just their amazing fitness regimens and physical strength.
It’s that they both need to follow a data-backed plan that includes monitoring key performance indicators to achieve success.
For example, throughout her career as a gymnastics champion, Simone Biles kept a journal to record her personal and performance goals.
Writing her goals helped her stay focused on what mattered most during a particular season or quarter and provided her with a way to look back at the progress she’d made.
Like many elite athletes, Biles keeps track of everything from her daily workouts to her competitive rankings. She knows that consistency and continual improvement are the keys to performing at her best.
High-performance athletes track a wide range of metrics to ensure they are at their best. But that doesn’t mean every metric is equally important.
Every Olympic contender knows they have to achieve minimum scores throughout the pre-selection season, or they won’t win a spot on the team.
This makes the athlete’s competition scores a high-impact or key metric–one that directly corresponds to their ultimate objective of winning a spot at the Olympics. Does showing up to training every day one time matter? Sure. But not as much as that score.
Anyone who’s competing to make the team is going to monitor their score and how it compares their competitors’ performances closely.
When assessing your progress toward achieving a goal, the metrics that best point to an answer are your key performance indicators (KPIs) or key success indicators (KSIs).
Email marketing KPIs are your high-impact metrics.
The metrics that email marketing teams and their leaders use to monitor the performance of their email marketing programs, campaigns, strategies, and other initiatives and the contribution those activities make toward achieving their organization’s business objectives.
To elevate your email marketing performance, you need to select the right metrics to set as KPIs and use them to guide your email strategy, make course corrections, and continually improve.
I’ll break down how to choose your KPIs and use them to go for the gold in this article.

I: What are email marketing KPIs?

Email marketing key performance indicators are a select set of key performance indicators that relate to the performance of email marketing programs or specific campaigns.
Key performance indicators (email or otherwise) are a distinct classification of measurements chosen for their probative value and significance.
KPIs are metrics that indicate whether a particular course is moving your team closer or farther away from success.
These super-metrics get special attention because they give teams an instant progress report and allow them to compare their present performance against past outcomes.
KPIs may be single-use, measuring whether a single campaign achieved its objective, measured at regular intervals to track and compare performances over time.
Actionable KPIs will define the desired level of performance or target and a means of determining whether the target has been reached (or how far off you landed) and in what time frame.
Email marketing KPIs may measure the success of an email marketing program in achieving organizational objectives and department-level objectives or monitor more granular list, segment, or individual campaign outcomes.
Examples of email marketing metrics that are useful as KPIs include:
- Cost per campaign or send
- Open rates
- Click-through or click-to-open rates
- Spam complaint rates
- Subscription list growth
- Revenue per campaign
- Conversion rates
Find a list of other top email marketing metrics and their calculation formulas in How email analytics can drive engagement.

How do KPIs differ from other metrics (or are they the same)?
All KPIs are metrics–measures of performance or status that are most often quantifiable to permit comparison.
However, not all metrics are KPIs.
Further, a metric suitable for use as a KPI in one situation may not be suitable in different circumstances.
Contextual significance and probative value distinguish KPIs from other metrics and it is these characteristics that you should use to select the KPIs for your email marketing program and campaigns.
What makes a metric significant and probative?
The assessment of a metric’s value is similar to the process used to select variants for an A/B test. Data-driven marketing requires identifying data that is useful upon which to base your decisions.
A metric has probative value and potential as a KPI if its presence or absence can influence or point toward a conclusion.
Does the metric serve as evidence of some other fact or conclusion? You should be able to identify a causal connection between the measure and a desired outcome.
When a fact demonstrates either progress toward a targeted outcome or has a strong correlation to a desired outcome, it has contextual significance.
At the opposite end of the metrics spectrum are measures that prove nothing or nothing of consequence. We sometimes call these measures vanity metrics. They look good, but lack substance. Open rates, for example, are sometimes referred to as such a metric.
Other metrics inhibit the space between the two extremes of key performance or success indicators and vanity metrics. These measurements and assessments provide useful, actionable information but aren’t powerful enough indicators of success to deserve KPI status.
For example, high click-through rates (CTR) are a strong indicator that the emails a brand sends are arriving in subscribers’ inboxes and being opened.
This same metric might also be an indicator that the email’s messaging is successfully earning clicks.
However, there could be other measures that would be more probative toward assessing the messaging’s effectiveness. Whether CTRs make the cut as a KPI for messaging may depend on what other data is available.
Are there qualitative as well as quantitative KPIs? And should you use both?
In most instances, KPIs are quantifiable, time-bound measures, such as a rate of return on investment during a designated period or the number of purchases per campaign.
Quantitative goals make communication and comparison easier, and these figures are usually more accessible faster.
There are situations where qualitative measures are necessary to gain actionable insights, though.
If your brand uses sentiment analysis, monitors unstructured feedback, or looks at other emotion- or opinion-driven data about your products or services, you are collecting qualitative data. Examples of qualitative metrics include your brand’s credibility or awareness among consumers.
Because qualitative data can be difficult to compare, often this information is converted into a quantitative form for use as a KPI.
For example, after collecting unstructured feedback from your email subscribers, you would use AI-guided sentiment analysis to categorize each response as positive, negative or neutral and then calculate the percentage of total responses represented in each category. Net promoter scores (NPS) are a popular way to quantify customer sentiment.
For organizations engaging in attraction marketing, understanding subscriber and customer likes and dislikes through qualitative analysis is essential.
Gathering feedback about the quality of the content delivered through email and other channels allows you to improve the experience you deliver to everyone in your target audience.
In addition to being subjective or objective, KPIs can tell you about the past or predict the future. When does a predictive or descriptive metric become KPI-worthy?
Leading, lagging, and in-between: How does a metric earn a place on the KPI podium?
A metric becomes a KPI if you decide that the data it produces tells you something that is important to assess your project or activity’s performance. If the performance of a certain metric strongly correlates to the achievement of your goal, it’s a good KPI candidate.
If there are several steps between cause and effect, you may be looking at a supporting metric rather than a KPI. Although… that supporting metric may be a leading indicator.
KPIs may be descriptive or predictive, and the same KPI may be both descriptive and predictive, depending on the context in which it is used.
Depending on whether your KPI is used to measure performance or anticipate it may be called a lagging or leading KPI. When selecting the KPIs for a particular project, most experts recommend you use a combination of both.
What are descriptive or lagging indicators?
Lagging indicators are the type of KPI that most of us are familiar with. This is a measure of a project’s output or results. Also known as descriptive indicators, lagging KPIs provide a snapshot of your performance at a specific moment in time and compare it to the goal you set.
A descriptive KPI tells you what happened in the past. When a gymnast completes their floor routine and the judges post the score, this is a descriptive KPI.
As an email marketer, you might use lagging indicators to answer questions such as
- Did the campaign generate the number of click-throughs we set as our goal? Or,
- Did the subscription churn rate exceed the maximum percentage we established as our KPI for Q1 of this year?
Don’t take the term “lagging” too seriously, though.
Although we say these KPIs are backward-looking, the look may take place in real time.
The KPIs are called “lagging” because by the time you receive the results, the event is over and there’s nothing you can do to influence its outcome. Plus, some outcome-based indicators take time to gather.
Lagging KPIs often serve as the base for creating future goals.
For instance, when determining a reasonable KPI for this year’s Mother’s Day email promotions, the performance metrics from last year’s campaign are a great place to start. Simone Biles may use her 9.7 score as a baseline to aim for a 9.9 in the next competition.
What are predictive or leading indicators?
Leading KPIs are predictive tools.
These are metrics you’ve identified as having a strong performance correlation with your goal or lagging KPI. When you monitor these as KPIs, it is to detect patterns or changes that may affect your objective.
You probably have a personal set of leading indicators you use to tell you when there’s trouble afoot with an email campaign.
Maybe you’ve learned through experience that if open rates don’t hit a certain percentage within the first few hours after you send a mass email campaign, conversions are going to be low.
Predictive KPIs are formalized versions of your instincts.
You may identify your predictive KPIs by looking at your historical data and personal experiences, then testing your hypothesis. You can also employ sophisticated algorithms to detect and verify correlations and develop a set of predictive KPIs for your categories.
An example of a leading/lagging KPI pair would be click-through and email conversion rates.
Imagine that based on historical performances, you know that the click-through to conversion ratio for a specific campaign template is 2:1.
On average, half of all your subscribers who click through after receiving a promotional email using this template will place an order.
This information makes your click-through rates a leading indicator for conversions. If your click-through rates for a specific campaign are unusually low, you can expect that your sales will be, too.
Depending on how much lead time your leading indicator gives you, you can sometimes use predictive KPIs to change the forecasted outcome. You just have to figure out what’s causing the deviation from your norm.
Maybe your link was broken? Did you forget to add the link? 😱
No, wait, you had some click-throughs.
Maybe more messages than usual ended up in subscribers’ spam folders or there was a delivery problem with a specific ISP. It’s not unusual to have to investigate several non-KPI metrics to track down the cause of a KPI failure.
For example, predictive KPIs can alert you so you can get a head start on working through the list of 23 reasons why your emails might land in the spam folder we compiled in a recent article.
A click-through rate is an example of KPI that can be leading and lagging simultaneously. It is a descriptive KPI for the email’s performance and a predictive KPI for conversions.
This also explains why click-through rates are a commonly tracked email marketing KPI. Knowing if your subscribers are clicking your links can tell you a LOT about your performance!

II: How to use internal and external KPIs to measure email marketing performance and accelerate growth

All of your organization’s KPIs are part of a larger system of metrics that take on varying degrees of significance depending on when and how they are used.
Leveraging all the data in your information ecosystem enables your team to maximize its performance and demonstrate measurable results.
External performance metrics may supply data that inform your email marketing KPIs, and your internal metrics will feed the greater flow of performance data throughout your organization.
How can you tell which data is internal or external?
We categorize KPIs as internal or external based on the source of the data.
In the case of your email marketing program, internal KPIs are metrics that are gathered by and relate directly to your department’s core competencies and functions. Key measures related to your entire organization or generated by other departments are called external KPIs.
Internal KPIs may be unique to a specific department’s activities, such as open rates for the email marketing team and resolution rates for the customer service department.
Internal metrics may also be general metrics that are applied to a specific unit’s performance. For example, different departments or groups may track customer acquisition costs (CAC) for distinct acquisition channels. (Your organization may also track a separate, aggregated CAC that encompasses all acquisition channels.)
In most instances, your internal KPIs will capture the bulk of your attention on a day-to-day basis. These measures may be relevant to other departments, but their granularity makes them most relevant within your organizational unit. Your company’s finance department will seldom have a reason to ask about your open rates and you probably aren’t checking up on your company’s quick ratio or CAGR daily.
External KPIs are important for confirming that your email program’s efforts are aligned with your brand’s ultimate goals. These KPIs may relate to market share growth or retention, the company’s financial health, or operational capacity.
Your email marketing program may not be solely responsible for increasing average order values (AOVs).
Nonetheless, if your organization has set a strategic objective to increase revenue, looking for signs that AOVs are on the rise will tell you if you are headed in the right direction.
You can then narrow your analysis further to determine if AOVs for orders generated via email are on par with or outperform other conversion channels.
Strategically, an external KPI indicating that customer satisfaction rates are declining may prompt your email team to create customer success-oriented campaigns featuring feedback surveys, product instructions via email onboarding sequences, or community values-themed content to contribute actively toward improving organizational performance.
Why use email marketing KPIs?
Monitoring both internal and external KPIs enables you to engage in full-funnel growth marketing strategies that strengthen your brand.
Carefully selected external and internal email marketing KPIs will enable you to:
- Develop and modify short- and long-term strategies. What’s working? Are there signs that something needs to change?
- Check your email marketing program’s health. Is our program on track to meet the internal goals we set? Are we meeting our obligations to contribute to external goals?
- Improve performance. You cannot know if a campaign or tactic is successful without a measurement of success.
- Test and compare tactics. Between two tactics or approaches, does one deliver better results? Does the initial top performer continue to deliver as expected over time?
- Identify opportunities. Use KPIs to pinpoint top-performing tactics and implement plans to replicate or transfer them to other segments or campaigns.
- Detect threats. A sudden change in a KPI can be an early warning of danger ahead.
- Solve problems. Key performance data can help you track down the source of a problem by eliminating possibilities or highlighting likely causes.
- Observe patterns. Not all threats and opportunities are immediately apparent. Sometimes, a trend develops slowly and is revealed through continual monitoring.
- Make predictions. KPIs aren’t just for reviewing the past. Key upstream data will give you insights into future downstream results.
- Ensure accountability. Goal setting and performance monitoring are essential for accountability. You need to know what the minimum acceptable standard is before asking your team to meet it.
- Maintain alignment. Is everyone in your organization on the same page? Is everyone in your department on the same page? KPIs are a means of communicating goals and expectations, facilitating clarity, and eliminating misunderstandings.
Teamwork makes the dream work! 🤝🏾
Now, let’s explore how you can choose the right mix of KPIs to not only monitor your performance but elevate it.
Mapping your path to success: How to determine the KPIs to use for your email marketing program and campaigns

Achieving greatness doesn’t happen overnight for individuals or companies.
Whatever the field of competition, top performers are committed to honing their skills, refining their strategies and investing in continuous improvement.
This is the formula for success.
Your data-informed path to success requires consistent use of well-selected KPIs. To choose KPIs that can drive positive action, focus on what you want to achieve and why you want to achieve it.
Then, define what success looks like.
Define your goals and the email marketing KPIs that will measure their achievement
KPIs are the measure used to demonstrate progress toward a goal.
But before you can measure your progress, you have to know where you are going. KPIs are the endpoint of a process that begins by defining your objectives.
There are several frameworks you can use to define your objectives and what you hope to gain from pursuing a particular goal. The framework you use to create your objectives should include methods of measuring success that match your output to your intent.
The objectives and key results (OKR) framework is an excellent method for connecting your KPIs to the objective of a program, campaign, or other email tactics. When you conduct an OKR exercise to clarify a campaign’s purpose, the “KR” portion of your output will be the campaign’s KPIs.
Another popular method for setting goals is the SMART framework.
Goals built using this framework are:
- Specific. Is the goal detailed enough to communicate your desired outcome with clarity? The more specific your goal is, the easier it will be to evaluate your results. You could state an objective as “increase the total number of subscribers for the coming quarter.” But, as a performance goal, “increase” is pretty vague. Defining the percentage increase or stating the specific number of new subscribers to add within a specific period would make a better goal statement.
- Measurable. Can you measure outcomes in a way that can be used for future comparisons? This relates to our quantitative versus qualitative dilemma. Your results should be capable of presentation as a metric so that you can assign values and make comparisons.
- Actionable. Will the data you obtain point you toward an action or means to improve? Performance input that doesn’t drive action can’t affect positive change or avert disaster.
- Relevant. Does the data point matter in the context of your objective? If your objective is to increase conversions, click-through, and click-to-open rates are more relevant than the device on which your message was opened.
- Time-bound. A never-ending measurement period means you never get a measurement. So, you’ll have to define the interval for assessment. This interval may be altered or regularly repeated to give you additional results for comparison.
Some companies substitute “attainable” and “reasonable” for “actionable” and “relevant” in their SMART frameworks. Setting goals that you have a reasonable belief can be met is a good strategy. Impossible goals can be inspirational but won’t give you useful performance data.
💡When you set a KPI for a campaign or program, you can also define degrees of performance, using the same metric to define a minimum acceptable or benchmark KPI and a reach goal or aspirational KPI. Think of it like awarding gold, silver and bronze medals for a competition.
For example, if your team is launching a new newsletter campaign aimed at increasing engagement among a specific audience segment, you might select click-through rates as a key performance metric.
Then, you define a 10% click-through rate (CTR) as your minimum KPI–anything less and the campaign is deemed a failure.
You could then define a target KPI of 15% CTR–this would be a successful campaign. Then, encourage your team to go for the gold with a super-target of 20% CTR. (Yay! Pizza all around!)
Designating success tiers within your KPI structure gives your team more information to work with as they seek to make incremental improvements that separate good performances from elite ones.
Identifying the email KPIs that are most relevant to each of your email marketing objectives
Email marketers have a lot of different metrics to keep track of.
Across your workflows and your subscribers’ journeys, different metrics will rise and fall in prominence.
As a part of your objective-to-KPI matching process, narrow down your choices by identifying those metrics that are most likely to serve as KPIs at each stage of your relationship with your customer.
Keep in mind, of course, that one stage’s lagging indicator may be the leading indicator for another, and you may need to draw from internal and external metrics to create your perfect KPI mix.
The following sections reveal the KPIs you can use to optimize your performance at every stage in your email marketing flow.
Stage 1: Who gets the message? List building and maintenance KPIs
At the heart of a successful email marketing program is its subscriber list. And if your subscriber list isn’t healthy, your program won’t be either.
Not every list-related metric will be a KPI for your program.
Choose the metrics that are most closely connected to your current list of goals and can provide you with the most direct insights into how to achieve those goals.
Subscription list growth and hygiene KPI candidates include:
- List growth or subscription acquisition rates
- Opt-in (sign-up) conversion rates
- Subscriber churn rates
- Unsubscribe rates
- Email validation failure rates
- Subscription form completion/abandonment rates
- Bounce rates
- Spam complaint rates
- Double opt-in or subscription confirmation response rates
- Re-engagement response rates
- Active audience rates
- High, medium and low engagement subscribers as a percentage of total subscribers
- Subscriber acquisition costs
Achieving a healthy list involves two activities: list building and list maintenance.
List-building KPIs tell you how you’re growing. An average subscriber list may see churn rates of between 20% and 50% annually when hard bounces, unsubscribes, spam complaints, and “silent” churn (a.k.a. zero-engagement subscribers) are included in that count.
That means you have to achieve double-digit new subscriber acquisition before your list can register any list growth.
It also means that when you’re trying to grow (or even maintain) your subscriber count, your KPIs will include new subscriber acquisition and subscriber churn rates.
Your subscription attrition or churn rate serves as a lagging indicator for subscriber retention and a leading indicator of growth.
Similarly, new subscriber rates tell you if you’ve met your weekly, monthly or quarterly acquisition goals while also telling you if you’re on track to increase your year-over-year subscriber total.
Unsubscribe rates can also deliver valuable insights as a predictor of list growth and an indicator of the performance of your sign-up and retention tactics.
If new subscribers are opting out after signing up, it may indicate that your emails don’t deliver the type or quality of content they expected when they signed up, you’re delivering too many messages or the audience your sign-up form attracts isn’t a good match for you.
Another signal that your sign-up form isn’t achieving its objective is a high rate of invalid emails. Email validation is the process of making sure an email address is real before you send any messages to it. You can validate emails before you add them to your subscription list or re-validate an existing list.
Validating emails at the time people sign up helps you detect fake addresses and incorrect entries. If you’re seeing a high rate of invalid addresses at sign-up, it’s time to investigate your lead generation process to identify the reason.
High unsubscribe rates can point to problems in your sign-up and engagement processes. But losing subscribers who weren’t that into you isn’t always a bad thing. Unengaged subscribers can have a huge impact on your email marketing costs, performance metrics and deliverability.
When you send emails to people who aren’t interested in receiving them, email clients register these unopened messages as unwanted.
Send too many unwanted messages and your sender reputation may take a hit. Plus, when you develop your messaging strategy, you want it to be for your active audience, not people who are ignoring you.
Your active audience rate is the number of subscribers who have opened or clicked on at least one email during a given period.
It can tell you how many of your subscribers have at least taken some interest in your emails during the most recent month, quarter or other period you define.
This KPI can also help you assess the effectiveness of your sunsetting and re-engagement campaigns. If your active audience percentage is low, that means you may be holding on to unengaged subscribers for too long.
List hygiene metrics tell you about your list maintenance practices. Uninterested or passive unsubscribers aren’t the only issue that can affect your deliverability and the health of your subscription list.
Sending messages to addresses that are no longer valid is even worse than sending them to an unengaged recipient. Invalid email addresses can trigger hard bounces or be converted into spam traps–two major reputation wreckers.
Monitoring your hard and soft bounce rates, spam complaints and the number of invalid emails your revalidation checks detect can help you understand how many of the emails on your list are associated with real people who want to be on your list.
What can you do to keep your list building and hygiene KPIs looking good?
Follow these best practices for email subscription list sign-ups:
- Offer visitors to your website a reason to join your list and remember to follow through with any promises you make right away!
- Use clear disclosures and plain language to inform subscribers what they are signing up for and what to expect from you.
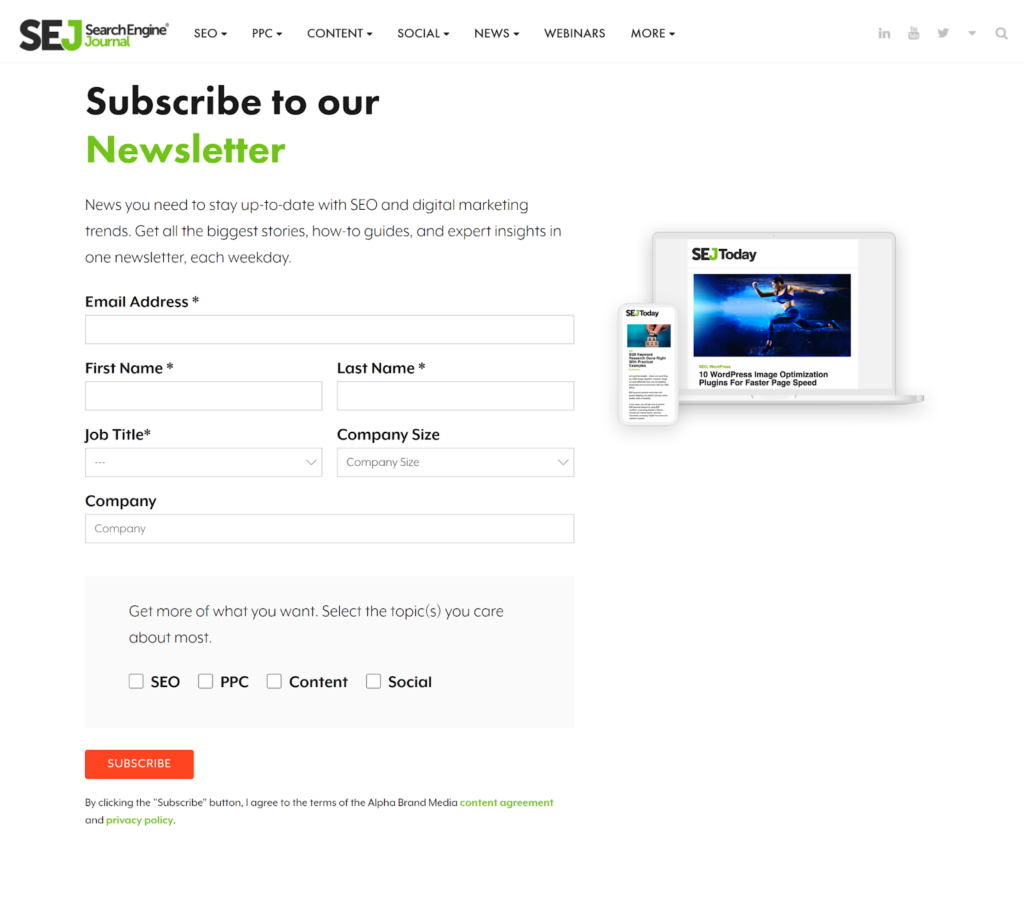
This sign-up form from Search Engine Journal notifies subscribers that they’ll get a newsletter every weekday. The page also invites new subscribers to share some zero-party data about their interests.
- Implement a double opt-in system to confirm new subscribers’ intent to subscribe.
- Make it easy for people to unsubscribe from your list and provide them with a preference center where they can adjust the type of messages they receive or opt down to receive fewer messages.
- Validate new email addresses before you add them to your subscription list and re-validate your lists if you see an increase in bounces or a drop in your sender reputation.
- Implement an automated sunsetting policy and remove subscribers that have been inactive for a designated period and don’t respond to your re-engagement efforts.
Delish hasn’t given up on this subscriber yet. This email aims to reactivate a waning relationship by offering content recommendations and asking for a click-through.
- Make sure your email service provider removes addresses associated with hard bounces and spam complaints automatically, and create a rule to remove addresses associated with multiple soft bounces.
- Don’t buy email lists.
- Do use organic growth strategies, including recruiting existing subscribers as advocates to grow your list.
Find additional tactics to build and maintain your list and keep your email list KPIs high in The Ultimate Guide To Sign-up Forms and The email hygiene complete guide.
Stage 2: Are you reaching your subscribers? Delivery and deliverability KPIs
Delivery and deliverability are two must-haves for a successful email campaign.
If you aren’t able to accomplish either of these objectives, your message won’t get through to your subscribers.
What’s the difference between the two?
Delivery is the technical process of getting an email message from its point of origin, your mail user agent (MAU) and the recipient’s email server or mail delivery agent (MDA).
If there’s a problem moving your message through the mail transfer agents (a.k.a. SMTP servers or relays), you have a delivery problem.
KPIs for monitoring delivery include:
- Delivery rate or the number of emails successfully delivered
- Requests or number of emails sent through a system
- Email server response times and outage event rates
- Incidence of rate limiting or throttling by one or more SMTP relays or email clients
- Hard and soft bounce rates
These metrics tell you how many of the emails you sent actually reach their destination, and alert you to the issues that may be preventing them from reaching their destination, such as a problem with a specific server or email client.
Deliverability addresses the recipient’s inbox provider’s willingness to let your message stick the landing. Email service providers (ESPs) are the rulemakers for the inboxes they service.
ESPs don’t have to allow your messages into their system or their customers’ inboxes. If an ESP deems your message unworthy, it may be refused and returned to sender or land in the customer’s spam folder.
This determination of who’s in and who’s out can be made globally for all the customers of a specific email client, a single client’s inbox, and even a single email message.
You may have noticed that emails from the same company sometimes land in your promotions folder and sometimes get sorted as spam. There’s a complex algorithm that decides each message’s fate and it can be capricious.
Delivery, deliverability, list health, and engagement share a lot of common KPIs. The data may have a different meaning in different contexts, though.
Your domain and sender reputation, the sending behaviors for a specific message and its content, and your technical infrastructure will all influence if your email makes it from your mailbox to your subscribers (delivery) and if it ends up in their inbox or their spam folder.
Among the deliverability metrics that you might select as KPIs are:
- Open rates
- Read rates which measure how long a message is viewed after it has been opened
- Non-open rates (the percentage of emails sent that aren’t opened)
- Device-specific delivery or open rates
- Hard and soft bounce rates
- Event lag or the amount of time between when you sent an email and when it was opened or clicked-through
- Spam trap rates 😬
When assessing your chances of being allowed past email client gatekeepers and making it to your subscribers’ inboxes, your list health and engagement KPIs are relevant. An active, engaged list signals to ISPs that your messages are welcome in their customers’ inboxes.
We’ve already reviewed the KPIs that indicate a healthy list and I’ll discuss engagement KPIs in the next section.
⚠️Your subscribers’ inbox service provider can see more metrics about your performance than you can. Because of differences in data sharing rules and privacy constraints, you may not have access to all of your subscribers’ open and read rates. Email service providers will have access to this information and can use it to decide whether your messages will make the cut.
Your inbox placement rate (IPR) is the KPI that reveals whether your emails are landing in a subscriber’s main inbox, their promotions tab, or directed to the spam folder.
However, getting your hands on this metric is a rare event.
In most cases, you’ll have to look at the engagement metrics I’ll discuss in the next section and extrapolate a placement rate from there. You can also use an app to send test emails and see where they land.
To improve your make-it-to-the-inbox KPIs, you need to know where you stand with ISPs and subscribers. This requires monitoring and maintaining your technical infrastructure, sending reputation and subscriber engagement.
Follow these best practices to maintain your good standing with all the important stakeholders in your email’s journey:
- Build a sending infrastructure that can support the volume of emails you send. If you are a high-volume sender, you may need one or more dedicated servers to handle the load and deliver your messages without throttling or delays.
- Ensure that your sending partners maintain good reputations. We recommend that bulk senders use a dedicated IP to avoid guilt by association.
- Don’t put all your email eggs in one basket. Every email associated with your domain has the potential to influence your sender and IP reputations. Protect your high-value IPs and those used to send transactional emails by not using them for low-engagement or otherwise reputation-risky campaigns. For example, if you are using multiple IPs to handle your sending volume, set aside one solely for double opt-in and re-engagement campaigns, which typically have low engagement rates.
- Monitor your domain reputation with email clients using postmaster tools and periodically check the primary blocklists. You can also sign up to receive feedback loop (FBL) data about spam complaints.
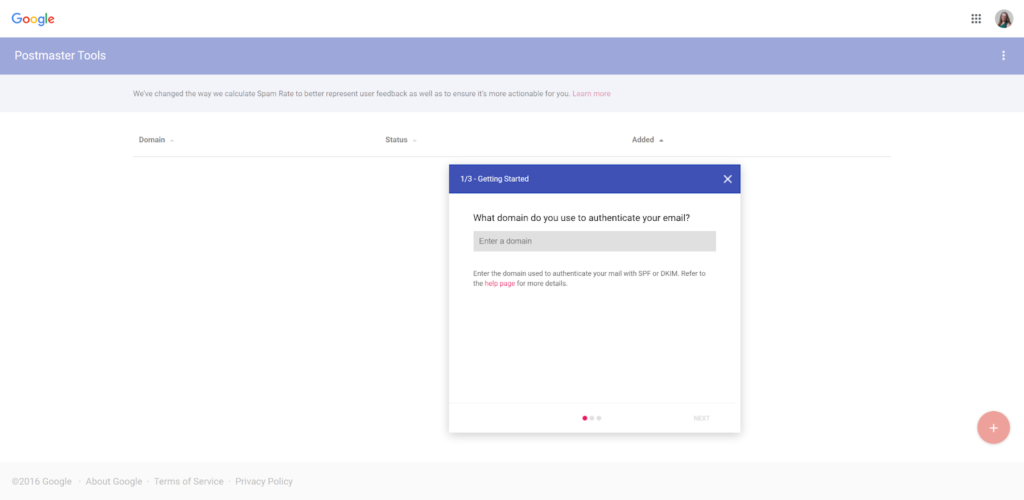
Sign up at postmaster.google.com to get a domain reputation check up.
- Implement Sender Policy Framework (SPF), Domain Keys Identified Mail (DKIM), and Domain Message Authentication Reporting and Conformance (DMARC) authentication protocols.
- Warming up new domains and IPs before scaling your email sending volume.
- Comply with government laws and regulations and industry guidelines for consumer privacy and data protection, including the EU’s General Data Protection Regulation (GDPR), Canada’s Anti-Spam Law (CASL), and the US CAN-SPAM Act.
- Maintain a universal suppression list to ensure that hard bounces and spam complaint addresses don’t come back to haunt you.
- Avoid sending emails at irregular times or volumes, sending the same message to the same address more than once or using hidden text, links or other sketchy stuff in your messages –this resembles the behavior of scammers.
- Check your messages for excessive file sizes and device incompatibilities. This can cause delivery problems and lower engagement rates.
- Make your subject lines inviting and genuine. Earning engagement begins with earning an open.
- Ask new subscribers to be on the lookout. Add instructions to your sign-up form or your after sign-up thank you page telling subscribers to watch for your first message and suggest that they add your email address to their contacts list.
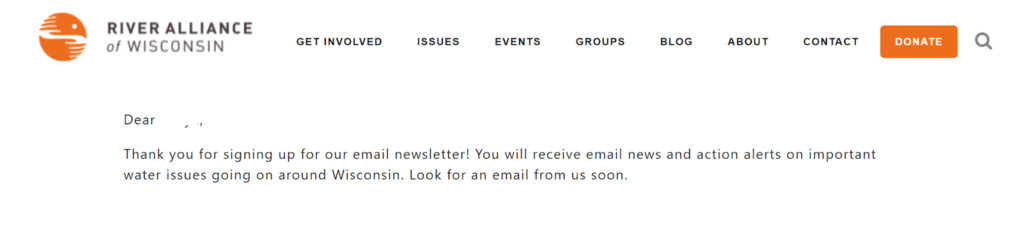
River Alliance of Wisconsin adds a polite BOLO advisory, “Look for an email from us soon,” to its thank you page.
- Use segmentation and personalization to send the right messages to the right recipients. You’ll get more opens and active engagement with your email messages if your content adds value for your recipients. Messages that subscribers find useful or entertaining will reduce your invisible unsubscribe numbers.
- Use behavioral and geolocation data to select a best time to send for each message and different audience segments. If you don’t know where (or when) to start, look at industry recommendations and conduct A/B testing of various send times to find out what works with your subscribers.
You’ll find more tactics for securing your place in your subscribers’ inboxes in our Email Deliverability Handbook.
Once you make it to your subscribers’ inboxes, how will you get them to open and click? That’s the next objective: Engagement.
Stage 3: Do your marketing emails capture your subscribers’ attention? Engagement KPIs
Earning customers’ attention is important to demonstrate to ISPs that your emails are wanted and aren’t spam. But convincing email clients to let you into their customers’ inboxes isn’t your end goal, it’s just an obstacle to be overcome.
What’s more important when setting your engagement KPIs is to choose ones that relate to your direct goals–acquiring, converting and retaining customers.
Select the metrics that are most closely linked to your campaign or project’s specific engagement goal as its email engagement KPIs. Do you want to increase social media activity? Get customer feedback? Build rapport?
The following metrics are among your KPI options for monitoring engagement performance:
- Open rates including unique opens, opens by device or email client, and by segment
- Read rates
- Click-through-rates (CTR)
- Click-to-open-rates (CTOR)
- Response rates (Yes, you can ask your subscribers to reply to your messages!)
- Action completion rates for polls, surveys or forms
- Rate at which your messages are forwarded or shared on social (Use a button for this to make it trackable)
- Unique clicks by link or URL. What links or CTAs drew attention?
Wait, wait, wait! Open rates? Aren’t they inaccessible, inaccurate, unreliable?
It’s true. Google’s image prefetch and proxy activities and Apple’s Mail Privacy Protection features are wreaking havoc on email marketers’ ability to know whether their pixels are signaling opens by people or bots.
The result of all these shenanigans is that Open rates aren’t the metric they used to be. Maybe they were never the metric we thought they were. But they still serve a purpose.
When you can get real ones (not the ones generated by pre-fetching and other assorted bot activity), open rates can tell you that:
✅ Your email made it to a subscriber’s inbox, answering the elusive inbox placement question.
✅ Your subject line and preview text got the subscriber’s attention.
✅ The subscriber was intrigued enough by your inbox appearance to open your message.
That’s good data!
Without an open, you can’t get a click-through. So open rates are a leading indicator of click-throughs and conversion events as well.
Some ESPs are trying to help marketers get a glimpse at genuine open rates by segmenting audiences by device or email client. Others are skipping the open rate dilemma and going straight for read rates.
Read rates are measured similarly to open rates by using a pixel to detect activity. However, unlike single-fire pixels which are downloaded once per open, read detection pixels are scripted to reload continuously while the email is open. The number of reloads or their interval can then be measured to gauge how long the email was opened.
Standards for read rates vary by provider. Some count a view of 3 seconds or more as “skimmed” and less than 3 seconds as “ignored.” Others take a less dim view of super-short looks and call them “glimpses.”
Read rates may also be calculated based on the length of the message. For example, a message would be counted as “read” if 30% of the message’s content was viewed.
According to one study, less than 20% of email marketers track read rates. A more commonly relied upon KPI is the email’s click-through rate (CTR).
CTRs are your faithful friend when it comes to monitoring engagement.
You can use UTMs or a pixel to track which subscribers click through the links you include in your emails to get a solid engagement measure.
By assigning different identifiers to each link in a message, you can track clicks per URL. You can also differentiate between unique (first-time) and repeat clicks on a link.
Using Ongage’s Conversion Points, you can further track whether a subscriber completes your designated conversion event, such as completing a form or making a purchase, after clicking through.
Adding open rate data, you can narrow your KPI further to indicate the number of click-throughs from your email openers (the click-to-open rate) rather than as a percentage of the total emails sent.
Click-throughs are a signal of engagement and indicate that your buyer is moving forward on their journey. The act of clicking on a link in your email may represent a micro-conversion or lead to one.
Email reply or response rates are an often under-appreciated email marketing KPI. But wow! Can you get any better attention from a subscriber than them actually wanting to interact with you?
As consumers continue to place a high value on personalized, human interactions with brands, how often you hear from your subscribers can tell you if you’re ahead of the competition or out of the running.
You may have instances where your objective or conversion event is not a purchase, though. For example, in an awareness or referral campaign, your goal may be to get subscribers to spread the word about your brand.
That’s when a KPI measuring forwards or shares is a better indicator of success. Pair this with external KPIs that measure upticks in mentions or favorable sentiment to see if your email message moved the needle.
So, how do you make all this great engagement happen?
Start by making a good impression in the inbox. In addition to a compelling subject line that inspires curiosity or tells recipients why your message is worth a click, make sure your sending name and reply address are familiar and inviting.
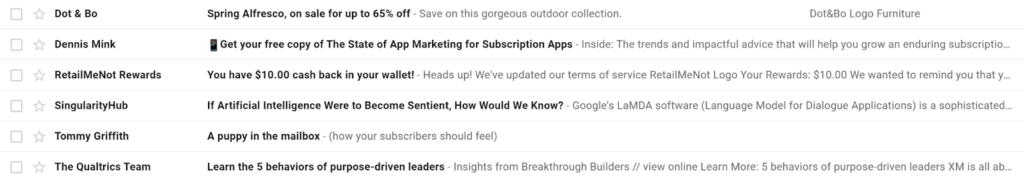
These inbox entries and subject lines illustrate several engaging tactics such as naming an individual sender, using specific numbers, asking questions, triggering curiosity and telling recipients what’s in it for them.
Leverage your pre-header text to add extra oomph to your subject line’s appeal. The Complete Guide for Fantastic Email Subject Lines will tell you all you need to know to craft Olympic-level subject lines.
Next, keep your eye on the prize from start to finish. Every word, image and formatting choice in your message should guide your recipients to the action you want them to take. Make that action clear with a call-to-action that is clear and conspicuous.
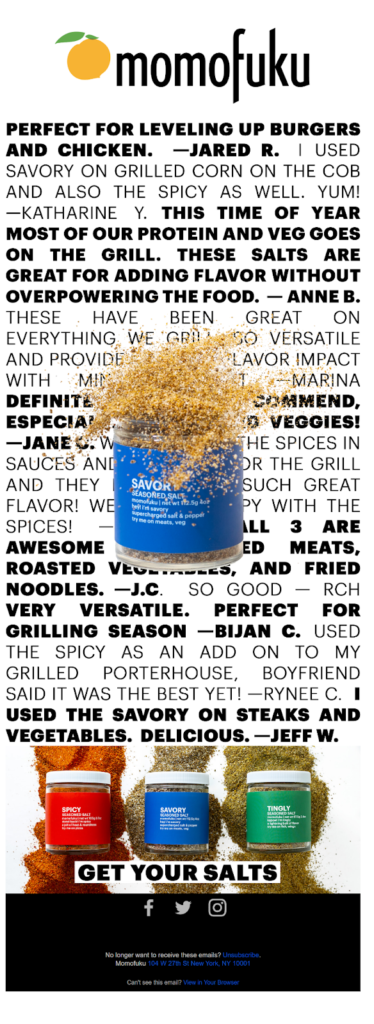
The CTA in this promotional email from Momofuku prompts readers to take the next step and, “Get Your Salts.” Placing the CTA on top of a colorful product shot helps the CTA button catch readers’ eyes. (Momofuku doubles up on its chances of making a sale in this message. Clicking on the centered product image takes you to the purchase page, too.)
Then fill your message with custom-tailored, value-adding content. Don’t just use your subscriber’s name and call it personalization.
Use dynamic email content to create truly one-of-a-kind messages that are distinctly relevant to every recipient. Combining templates that include dynamic fields and blocks, customer data from your proprietary customer database, segmentation and automation, you can create amazingly unique emails that communicate to your subscribers that you care more than that competing brand. 😉
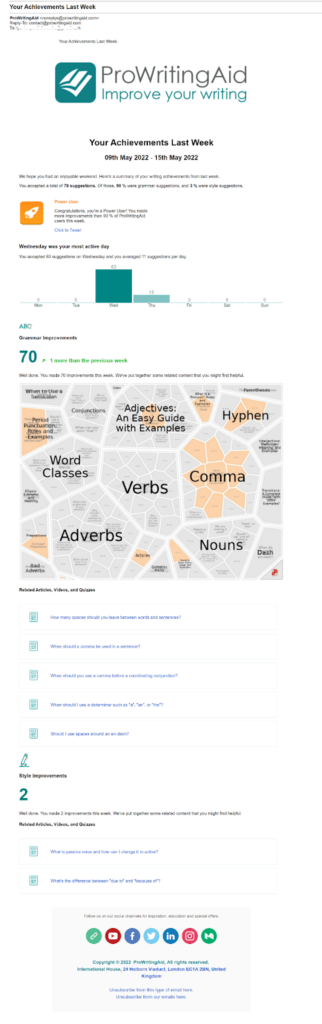
Brands like ProWritingAid use dynamic blocks to create individualized user productivity updates at scale. I can confirm that the data doesn’t lie. Commas are my nemesis.
Also, this may seem obvious, but if you want engagement, invite engagement. Invite your subscribers to reply to your email with their ideas or thoughts on a question you’ve posed. Include interactive polls or links to surveys in your messages. Ask your customers for written feedback, one-click reviews, and invite them to submit user-generated content.

HR.com closes out its email newsletter with several engagement opportunities including an invitation to write for the publication, take part in a survey or follow the brand on social media
Finally, make sure your emails look good and are accessible. Test your messages on different devices and email clients to ensure that your images render correctly and your messages aren’t cut off. Add alt-text to express your ideas to recipients who are visually impaired or block images.
Choose attractive colors and clean templates that reflect your brand’s image and persona. And use A/B testing to find out what works for your audience.
Along with these tips that apply to any email, you can also boost your engagement KPIs with best practices for specific types of emails. For example, if you offer a coupon or other incentive for first-time subscribers, there’s a good chance they’ll open your first email to get that incentive.
Don’t waste this opportunity to get the engagement ball rolling. Add a click-through element such as a game, additional incentive or poll to encourage them to interact with your message.
In your welcome email series and subsequent campaigns, send a mix of content. Provide encouragement, a sense of community, education and inspiration, along with news of your latest products and promotions. Give people a reason to look forward to hearing from your brand. Tell them about your preference center, too.
Encouraging subscribers to visit your preference center to tell you about their interests and communication wishes authentically communicates your interest in them and may earn you a click-through.
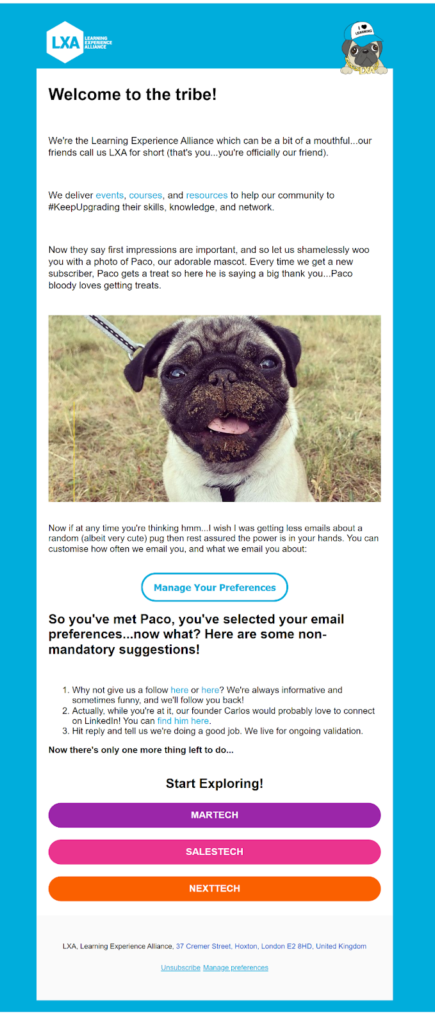
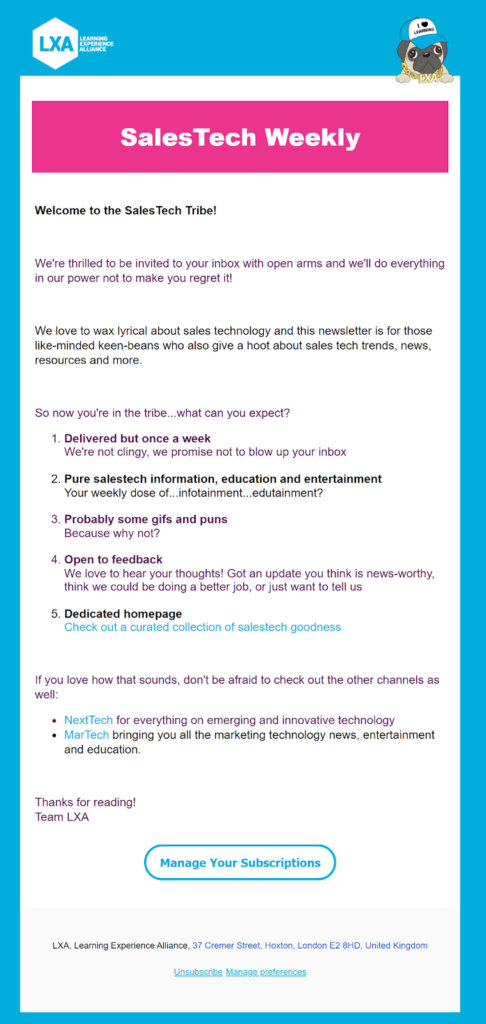
Learning Experience Alliance’s (LXA) colorful welcome campaign includes two messages introducing new subscribers to the brand voice and reiterates what they can expect to get out of signing up. The welcome messages each include several links to resources, and a featured CTA button that encourages subscribers to visit the company’s preference page.
Up next, the email marketing KPIs that measure conversion performance and how to raise your numbers.
Stage 4: Going for the gold – KPIs to measure customer acquisition and conversions
Email marketing enables brands to have one-to-many conversations with their entire subscription base, and develop one-to-one communications at scale.
Email messages can facilitate top-of-funnel introductions and guide subscribers toward conversions. Sometimes, the email’s purpose is accomplished by the subscriber reading it.
For example, a transactional email that offers an update or an informational newsletter that demonstrates your brand’s expertise. These emails are like individual competitors on a gymnastics team. Each one is individually scored for their performances and those performances also contribute to the team’s all-around score.
But often, your email campaign is more like the third runner in a relay race who hands off the baton to the anchor. It’s the last touch point before the conversion event.
Measuring what happens after the click-through tells you how well your email performed as an individual player and as a supporting player in your organization’s growth objectives.
KPIs are supposed to represent the metrics that matter most. That’s probably the reason there are so many conversion-related metrics from which you can choose when setting an email campaign’s KPIs.
Take your pick of these conversion-related metrics to serve as KPIs for your email marketing program or individual campaigns:
- Email conversion rates or the percentage of subscribers who complete your desired action after receiving your email.
- Post-click conversion rates. Your email conversion rate is based on a defined conversion event associated with the campaign. You can expand on that by using attribution modeling to identify any conversions associated with a specific email. Maybe your goal was to get the subscriber to download an ebook, and they signed up for your app instead. Bonus win!
- Email ROI. This measures your revenue from a single campaign or your email marketing program for a defined period after subtracting all the costs of the campaign or program.
- Revenue and/or net profit per subscriber for a given period.
- Revenue and/or net profit per campaign, email or segment for a designated period.
- Cost per conversion
- Post-click form completion or abandonment rates
- Download rates for gated and ungated content, webinar or similar registration rates, or completion rates for surveys, forms or other non-revenue generating conversion events.
- Average subscriber lifecycle length. How long do your subscribers stick around?
- Subscriber to customer ratio
- Length of sales cycle. Are your email efforts accelerating the path to conversion?
- Post-click time on site and number of page views.
- Abandoned browse and cart rates.
- Cart and browse recovery rates. How effective are your abandoned cart emails?
- Post-click average order values and basket size or number of items purchased.
See what I mean? There’s a lot to consider when selecting conversion-focused email marketing KPIs.
You probably noticed that a lot of these metrics are external. They may be tracked by your digital marketing or ecommerce teams in addition to or instead of your email team. The numbers still point to the effectiveness of your email marketing program, though. So it’s important for your team to monitor them.
Improving your conversion and ROI KPIs can and should be approached from several directions. You can boost these KPIs by reducing the costs of conversions, increasing revenue per conversion, and increasing the total number of conversions you attain.
Simple, right?
Put your performance in overdrive with the following conversion-optimization tactics.
⇨ Keep your ROI high and costs low by concentrating on message-market fit. You can reduce your costs per email conversion and increase the number of conversions by improving the efficiency of your email targeting through segmentation and personalization. Send the right message to the right audience at the right time.
Create offers your subscribers can’t refuse by segmenting your audience based on their position in your sales funnel or use behavioral data to create segments based on buying intent.
Hyper-personalize your buyer’s journey by creating drip campaigns that automatically send the right message at the right time to each subscriber.
Also, plan your sending calendar strategically. Your subscribers don’t want or need “just because” emails in their inboxes and you don’t need to waste time or resources creating content that doesn’t have a defined purpose.
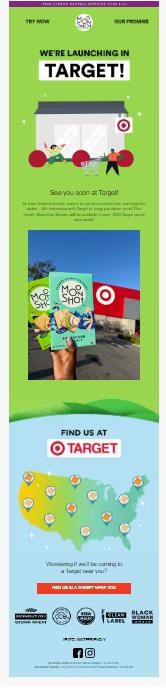
Moonshot makes a splash with this email announcing a convenient new way for customers to purchase its products which were previously only available online. The message adds value (and serves a purpose) by informing customers of their new shopping options.
⇨ Systematize and automate your email marketing workflows for maximum productivity. Another route to reducing costs per conversion is to improve your production efficiency. Create a selection of templates based on your brand’s style guide to streamline the production of engaging, well-formatted emails. Use automation to build personalized emails at scale and keep your lists clean and up-to-date.
⇨ Make the handoff from email to website smooth. The handoff is a critical element in a relay race and it is for your email conversion rates, too. A smooth handoff is low-friction.
To make this happen, reduce the number of steps your subscribers have to take to complete their conversion action after reaching your website.
If you invite someone to your website through a personalized email, use automation to reduce the number of questions you need to ask once they arrive. Do I really need to fill out the gated content form if you already know me?
⇨ Avoid “clickbait” emails. Keep your messaging consistent between your email and your destination page. If your email promises your biggest sale of the year, your website needs to deliver the big deals.
Also, make sure your email’s links take subscribers straight to the promoted item or element. If I click on shoes, I wanna see shoes when I get there. If your email features multiple articles, products or offers, use unique links for each one.
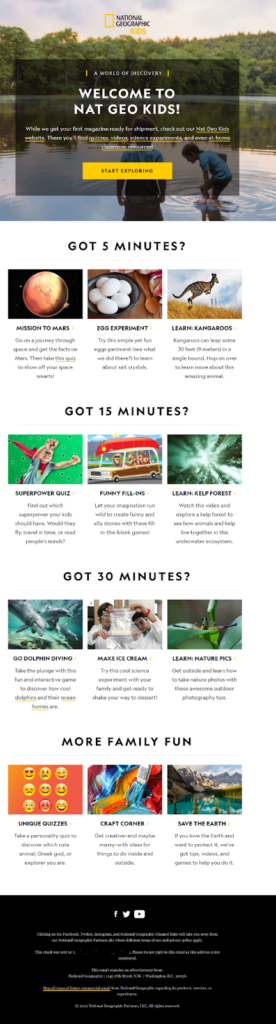
Each link in this Nat Geo Kids welcome email takes the reader to the relevant activity page or recommended content, making navigation effortless.
⇨ Convert new subscribers to customers as soon as possible (without being pushy). The sooner you convert a new subscriber into a customer, the sooner you can impress them with your great products and services and begin building brand loyalty.
Send your welcome email as soon as a new subscriber signs up, and consider offering first-time purchase incentives or a trial of your services. Ask new subscribers to share their preferences and track their on-site behavior so you can build a profile that will enable you to send them custom-tailored offers for the win.
⇨ Look for opportunities to enhance revenue. One sale is great. Repeat sales are better. In addition to personalizing your content and offers, use onboarding and customer success emails to ensure that new customers are satisfied.
Follow-up with satisfied purchasers by sending upsell and cross-sell recommendations. And don’t forget the power of email automation. Set up event-triggered replenishment campaigns to remind your customers to place an order before they run out of consumable products.
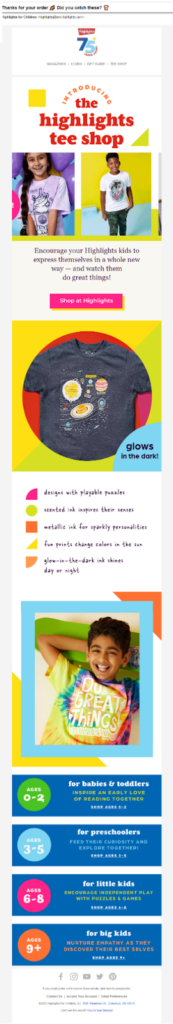
A purchase from Highlights online merchandise shop triggers a “Thank You” email that includes additional product recommendations.
⇨ Use abandoned browse and abandoned cart campaigns to recover (almost) lost sales. “It ain’t over til it’s over.” Elite athletes don’t win every time. But they also don’t give up. You won’t win back every customer who walks away after browsing your website or placing an item in their cart. But if you don’t try, you’re just leaving the money behind!
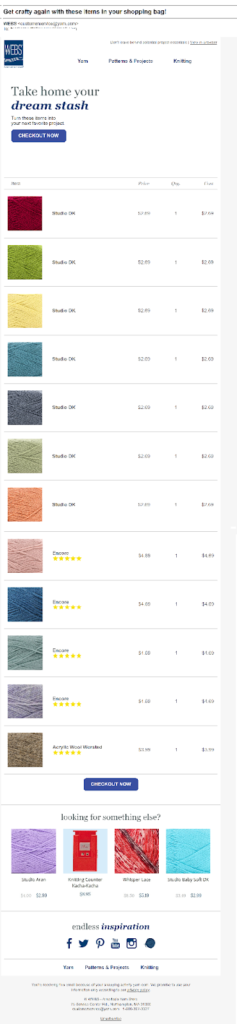
Online and brick and mortar yarn shop Webs uses a cart recovery email template that deploys dynamic content and product recommendations to show subscribers the merchandise that’s waiting for them and offer alternatives.
Ongage’s automation, dynamic content and Events and Triggers features allow you to create personalized recovery messages that you can have sent at just the right moment to recapture a shopper’s wandering attention.
Want more CRO? Haim’s stellar guide, Conversion Rate Optimization for Email Marketing Stars, is chock-full of more tips to analyze and enhance your conversion performance.
Stage 5: Gain strength from your fans: Retention and referral KPIs
Customer loyalty, social proof, testimonials and referrals–these are solid gold when it comes to performance.
Your email program can contribute to building each of these categories for your brand by promoting your loyalty and referral programs, encouraging feedback, sending surveys and communicating your commitment to customer satisfaction.
KPIs that measure customer experience, loyalty and advocacy include:
- Subscriber lifetime value
- VIP or loyalty program participation rates
- Referral rates
- On-site and third-party site review rates and star ratings
- Net promoter score (NPS)
- Social media mentions
- User generated content (UGC) submission or share rates
- Sentiment analysis scores
What can you do to get customers to like you (a lot) and move these growth-focused KPIs higher?
Keep doing what you’re doing to boost your other metrics, plus:
- Treat your subscribers like humans, not revenue streams. When you craft an email, think about its content from your subscriber’s point of view. What do they want to see? How will your message improve their day?
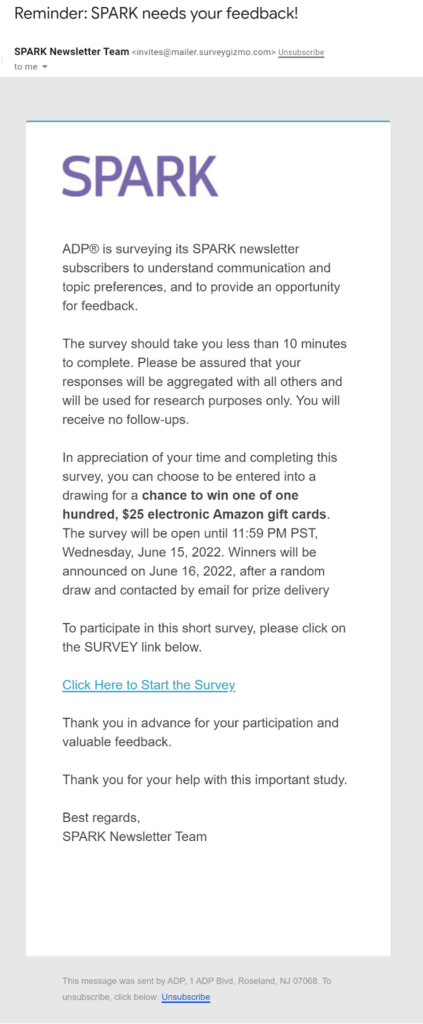
Inviting your subscribers to participate in a survey as ADP has in this email seeking input about its SPARK newsletter provides you with valuable qualitative feedback, encourages engagement and facilitates two-way conversations.
- Create content that offers them convenience or makes them smile. Solve their problems!
- Develop a sense of community among your subscribers by sharing their posts, feedback and USG in your emails.
- Use your messages to comment on issues that matter to your customers. A 2022 study found that 82% of shoppers prefer brands that share the shoppers’ values.
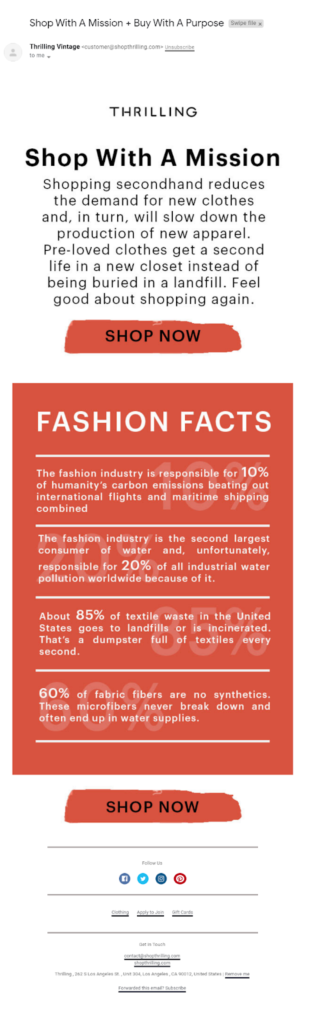
Sustainable shopping is a core component of clothing reseller Thrilling Vintage’s value proposition–and a value it shares with its customers.
- Nurture long-term relationships with your customers with communications that show you value them. There’s a song I learned at camp as a child that included the refrain, “Make new friends but keep the old; one is silver and the other gold.”
- Don’t take your loyal customers for granted. Loyal customers are more likely to try new products and refer other people to your brand. Sustaining your customer relationships by developing content specifically for subscribers at different stages in their customer lifecycle will boost your sales and your brand’s reputation.
- Encourage your customers to share their affinity for your brand by creating and promoting formal referral programs that reward both the referrer and the referee.
- Finally, be responsive to the feedback you receive. Consumers’ expectations are constantly on the move. Listen to what your subscribers are telling you (through their words and actions) and demonstrate that you are paying attention.
Focus, determination and a dedication to continuous improvement separates good performances from great ones. Use these tips to prepare for your moment of greatness.
Continue your journey to peak performance with award-winning copy using tips from our latest messaging masterpiece, How to level up your email copywriting skills—a step-by-step guide.
What are the most important KPIs in email marketing for 2023?

I’ve sprinkled lots of metrics throughout this article and I know it’s given you a lot to think about it.
So to make it easier to choose the KPIs for your next email marketing campaign, I’ve assembled the top email marketing KPIs into this master list for you.
As you prepare your email marketing campaigns in 2023 and audit your email marketing program to prepare for the future, use this guide to help you select the KPIs that will keep you informed and on the right track.
Checklist: 53 Email Marketing Key Performance Indicators
Email list building and maintenance KPIs
- List growth or subscription acquisition rates
- Opt-in request to consent ratio
- Subscriber churn rates
- Unsubscribe rates
- Email validation failure rates
- Subscription form completion/abandonment rates
- Hard and soft bounce rates
- Spam complaint rates
- Double opt-in or subscription confirmation response rates
- Re-engagement response rates
- Active audience rates
- High, medium and low engagement subscribers as a percentage of total subscribers
- Subscriber acquisition costs
Email delivery and infrastructure KPIs
- Delivery rate
- Device-specific delivery rates
- Requests per system
- Email server response times and outage event rates
- Incidence of rate limiting or throttling
- Event lags
- Spam trap rates
Email deliverability and engagement KPIs
- Non-open rates
- Open rates including unique opens, opens by device or email client, and by segment
- Email read rates
- Click-through-rates (CTR)
- Click-to-open-rates (CTOR)
- Email response or reply rates
- Action completion rates
- Rate at which your messages are forwarded or shared on social
- Unique clicks by link or URL.
Email marketing conversion KPIs
- Email conversion rates
- Post-click conversion rates
- Email ROI
- Revenue and/or net profit per subscriber for a given period
- Revenue and/or net profit per campaign, email or segment for a designated period
- Cost per conversion
- Post-click form completion or abandonment rates
- Post-click download rates
- Average subscriber lifecycle length
- Subscriber to customer ratio
- Length of sales cycle
- Post-click time on site and number of page views
- Abandoned browse and cart rates
- Cart and browse recovery rates
- Post-click average order values
- Post-click basket size
Customer lifecycle and sentiment KPIs
- Subscriber lifetime value
- VIP or loyalty program participation rates
- Referral rates
- On-site and third-party site review rates and star ratings
- Net promoter score (NPS)
- Social media mentions
- User generated content (UGC) submission or share rates
- Sentiment analysis scores
Going for the gold requires drive and focus. Make sure your team is focused on what matters by setting the right KPIs for email marketing success.


 Academy