


A/B testing is a data-driven method for detecting the reason behind the results. It’s so much more than just finding the right colors for buttons! With the right A/B testing methodology, you’ll be able to advance your strategy from conjecture to certainty. Let’s start first by bookmarking this post (you’ll refer to it a lot in the future), and after that, evolve to `humano hoc probat’ (the human that tests).
If you’re asking why you should be using A/B testing? The answer is simple. It’s your email operation’s natural selection process.
In the natural world, survival of the fittest is the law of the land. Plants and animals that don’t adapt to changes in their environment face extinction. To stay relevant and avoid the extinction mentioned above, you must continuously adjust your strategies to meet changing consumer expectations and competitive pressures.
But making changes to your email campaigns can be risky.
What if you make the wrong choice? With so much at stake, relying on guesswork is a bad idea.
Email A/B testing uses the scientific principles of randomized control testing to evaluate a new strategy before you implement it. Plus, each set of test results provides you with actionable insights you can use to evolve your marketing strategy.
But A/B testing only works if you do it right. Getting accurate results requires following a few rules.
Read on and learn how to pick a winner.

Here’s why the survival of the fittest has an email edition
Testing until you’re successful is all around you. Nature made sure of that.
When plants or animals evolve traits to help them survive, it’s called positive natural selection. The process usually takes several generations, during which plants or animals with positive genetic traits reproduce and pass on their genes. Meanwhile, negative or unrequired traits slowly fade away as they are eliminated from the gene pool.
This process is, of course, not perfect. There are many traits that are passed down the line and (as to our current understanding) serve no evolutionary purpose. But in general, nature has a strategy, and she continually tests her tactics.
From their subject lines to their sending times, all the elements of your emails are the genetic building block of your email’s DNA.
Each factor either positively or negatively influences your emails’ performance. How well you cultivate subsequent generations of emails by identifying which “genes” to keep and which need to be eliminated will determine the success of your email marketing operation.
A/B testing helps you sort the good from the duds, continually improving your emails’ DNA. Let me share some of the benefits of the process before we dig into the “how-to’s” of email A/B testing.
If you’re already 100% onboard, click here and get down to business.

Why do we do AB testing in email marketing?
Most email marketers have a list of best practices they follow when preparing and sending emails. These best practices may include:
- Writing a subject line with less than 50 characters.
- Inserting a single CTA per email.
- Sending your emails on a Tuesday morning.
And much more.
With all that information, why do you need to try new ideas with A/B testing? Here are several good reasons to continually test your emails, even if you think they’re perfect:
- It’s better than trying out new ideas without A/B testing.
A small percentage change in your conversion rate could make a big difference to your bottom line.
Do you really want to send a new email template to your entire subscription list and risk a drop in conversions?
A/B testing reduces the chances of you making costly mistakes. Further, when you try new ideas without testing, you don’t really know which idea is the better one, and you end up guessing again.
- Consumer behavior isn’t static, and your email best practices can’t be either.
Consumer preferences and engagement levels change over time.
A strategy that worked six months ago might not work now, or it might not work with one or more of your segments. But, on the other hand, maybe it works even better now, and you should be using it with more segments.
If you don’t test, you’ll never know.
It’s that simple when you track and analyze.
- You’ll gain real data about how your customers respond.
Unlike a survey or your best guess about what might happen, A/B testing measures the actual responses of a small segment of your subscriber list.
Did they click? Did they convert?
Even a negative outcome to your test email provides you with valuable insights–straight from the source.
- It connects ideas to outcomes.
You may have heard the saying, “Correlation doesn’t equal causation.”
Was it just a coincidence that conversions increased after you changed the color of your CTA?
Was there something else going on that day that caused people to purchase more than usual?
A properly designed A/B test should account for potential variables and help you confirm the causal link between what you changed and the results it generated.
For example, in a 2020 interview, Shmuel Herschberg of Shyn Media told us that when he split-tested two different email templates for one of his clients, a simple-text option delivered a 29% increase in engagement rates over a fancier counterpart.
- A/B testing injects certainty into your planning process.
One of the core principles of scientific testing is that the results be repeatable. A/B testing forces you to create a defined set of parameters for each test.
A campaign strategy that only works once isn’t nearly as valuable as one that will work across segments for several weeks or months.
Use your test parameters to compare and revalidate campaign ideas and identify replicable winning strategies.
- You gain an exclusive, actionable knowledge base that can be used across your organization.
The results of every test–whether positive, negative, or neutral–provides data that can be saved, shared, and used to define future strategies.
You’ll build a unique body of data that is specific to your subscribers and your brand. Share this audience intel with your marketing, product development, and sales teams and leave your competition behind.
- It’s great for settling bets between members of your marketing team.
Our tests are as good as your hypotheses and ideas. That’s why you should make it a priority to motivate your team and inspire creativity.
The best way to do that is via gamifying everything. Everyone loves to win.
Gamification of the A/B testing process will bring in some fun and motivate your team to develop new ideas for tests and possible outcomes.
Ready to pick some winners? Here’s how to A/B test your emails and find the winning combination.

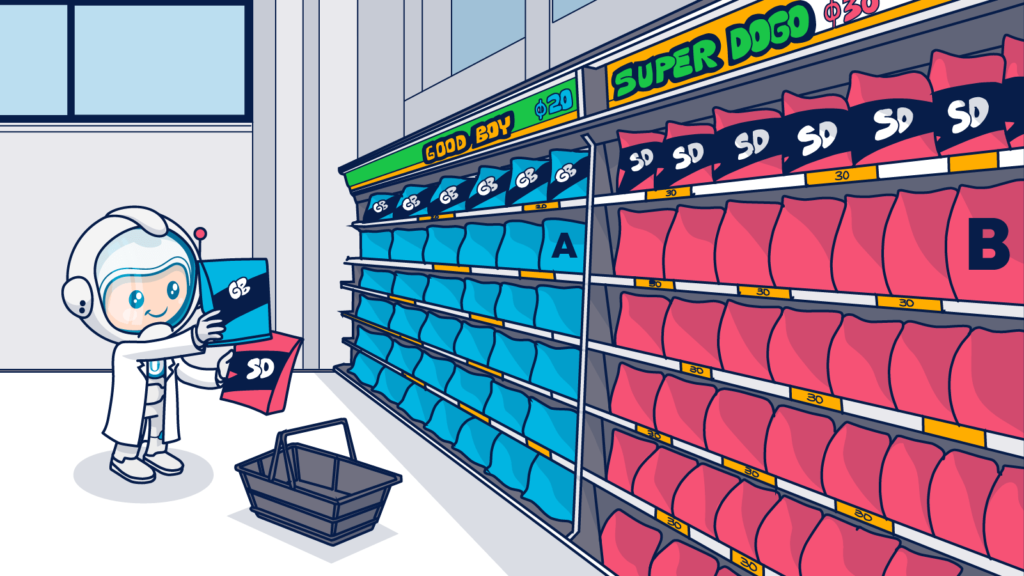
Identifying the A and B in A/B testing

What’s null? How to choose a control? And how to challenge the status quo?
A/B testing is also known as split testing because when you conduct your test, you’ll select a portion of your audience and then split them into two groups. One group will receive the “A” version of your email, and the other gets version “B.”
How do you select what to test?
In traditional A/B testing, A is always the incumbent, and B is the challenger to the status quo. Option A is the control or baseline–it’s a known quantity or standard.
Researchers hope to unseat the incumbent or nullify it during testing, so they call A the “null hypothesis.” The challenger is called the “alternative hypothesis.” A little confusing, but that’s how science rolls.
While stating the null hypothesis, researchers also select a metric to compare A and B to determine whether there’s a difference between them.
The metric is used to choose the winner. When tested under identical conditions, does B match A’s performance, exceed it, or fall behind?
For example, researchers might start with a null hypothesis such as:
“Design does not affect click-through rates.”
In this case, the difference between the two conditions, the design of the email, is known as the variant or the variable that will be tested.
The next step would be to select a group of similar subscribers and randomly divide them into A and B groups. Group A would receive the control design (let’s say a single column design), and Group B, the variant design (let’s say a dual column design).
If Group B generated more clicks than Group A, then the null hypothesis would be disproven or nullified. Meaning, the design of the email does have an effect (a positive one) on CTR.
Of course, there are many steps between hypothesis formation and conclusion, but that’s the gist of it.
Attaining statistically significant results and avoiding errors
There are three kinds of lies: lies, damned lies, and statistics. ~ Mark Twain, Chapters from My Autobiography
At the outset of this post, I pointed out that A/B testing brings certainty to your speculations. However, even the best-designed test can’t eliminate all uncertainty.
The results of an A/B test are still just a prediction, not a guarantee of future performance.
A poorly designed test will generate unreliable or easy to misinterpret results. For example, if you don’t have an adequate sample size or make other design errors, your data can deceive you.
Natural variances can also impact your results. If you were to conduct an A/A test, pitting the same email against itself, your results for each sample group (A1 and A2) would still be different.
Pursuing statistical significance helps you limit the impact of natural differences and faulty conclusions.
This is critical to your overall success because picking an illegitimate winner can be an expensive mistake. Plus, a result that happens by chance isn’t replicable and doesn’t help your email campaigns evolve.
To do that, there are a few goals that you should strive to reach in your search for significance.
Finding what counts as significant
Most testers aim for a 95% certainty level. This means there’s a 95% chance that the test results are real and a mere 5% chance that the outcome was just a coincidence.
But there is an opportunity cost to setting your significance rate that high. You may miss out on a great opportunity to shake things up in your email campaigns by setting the bar too high.
Requiring a lower level of certainty, such as 85%, will help you identify winners and take action faster. This, too, comes at a cost, as now there’s a 15% chance your significant outcome is, in fact, a coincidence.
As you can see, both approaches have their pros and cons. You should consider your level of risk tolerance confidence in your alternative hypothesis when deciding where to draw your line.
Seeking statistical significance and avoiding errors
A result’s statistical significance is a measure of how likely it is that the results could have happened by coincidence rather than the cause.
You arrive at statistical significance by asking yourself,
“How rare is this result, assuming my null hypothesis is true?”
This is your “probability of observation,” and it can be charted as a bell graph like the one below created by Georgi Georgiev at Analytics-Toolkit.
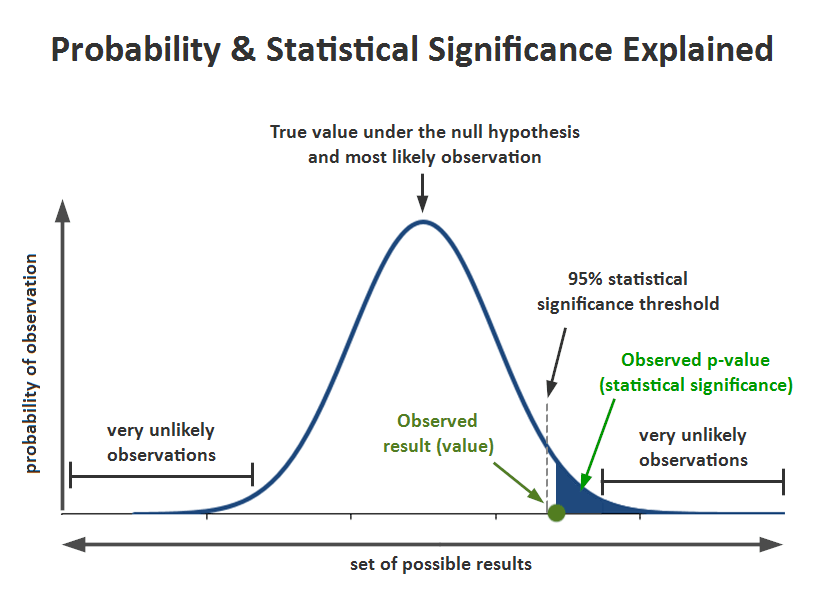
Your range of possible outcomes may be based on past performance data or your estimations (more on that later). The level of significance you choose for your test is expressed as the statistically significant threshold. Any value that sits on its right will support your alternative hypothesis.
You may see statistical significance described as the probability or p-value. Your p-value is calculated after running the test, and it tells you how likely the difference you found between A and B is a coincidence.
For example, if your p-value is 0.08, it means there’s an 8% chance the difference found isn’t real. Is the difference statistically significant? That depends on what you set as your significance value. If it was 95%, then the differences aren’t statistically significant. But if it was 85%, then they are. See how that works?
P-values are calculated using a probability distribution formula. Here’s a p-value calculator that does it for you.
“Significance levels and p-values help you evaluate the validity of your results and avoid errors.”
A result that passes the significance threshold indicates that you have most likely not mistaken a coincidence for a win. In other words, the null hypothesis is legitimately lost.
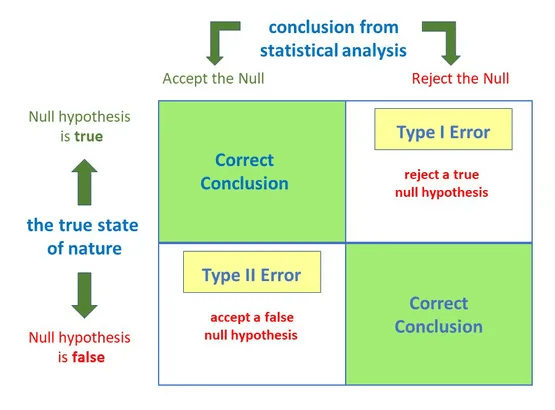
Mistaking a coincidence for a win is referred to as a Type I Error–you wrongly rejected the null hypothesis in favor of a pretender. This type of error is more likely to happen if your significance threshold is low.
Calculating confidence in A/B testing
Confidence intervals and confidence levels are alternative methods for defining significance when a baseline performance metric isn’t available.
Setting a confidence level helps you (or your sample size calculator) decide just how far from the control’s mean performance your results need to represent a real difference in impact.
To set your level, you’ll first define the `confidence interval’ or the expected range of results for a particular test. When setting your parameters, a 95% `confidence level’ means that researchers are certain that a test’s results will fall within a specified range or “interval” (as opposed to an exact number) 95% of the time.
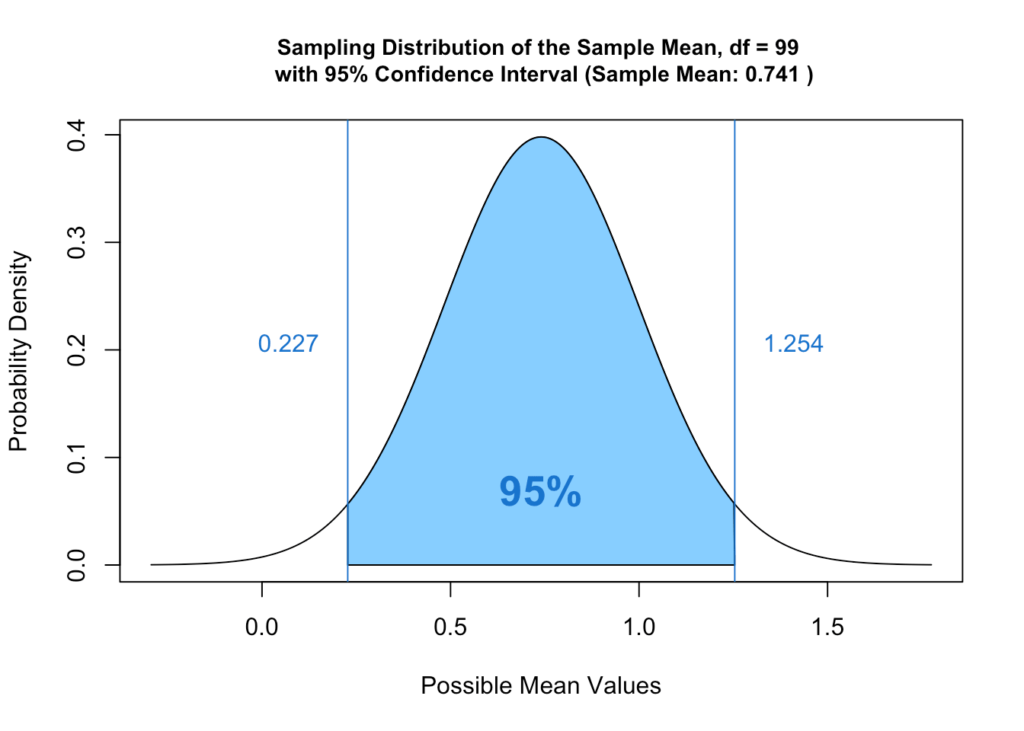
Notice that the confidence interval graph very much resembles the range of “most likely observations” in the significance chart. The difference is that a confidence interval isn’t based on a true mean established by past performance.
Significance thresholds, p-values, and confidence levels all affect the parameters you’ll use for your tests, such as duration, effect, and sample size, to ensure statistical significance.
Setting a high significance level, such as 98%, will give you more precise results, but you’ll need a larger sample size to do it.
Also, if you fail to gather enough data because your sample size was too small, you may mistakenly reject a good idea because it didn’t beat the null hypothesis in your test.
This mistake in favor of the status quo is known as a Type II error.
Avoiding both Type I Errors (wrongly rejecting the control) and Type II errors (wrongly rejecting the alternative) requires careful balancing of your sample size, effect magnitude, and significance criteria.
As you design your email A/B test, you should be on the lookout for opportunities to fine-tune each element to avoid errors and improve the statistical accuracy of your results.
Why so many different methods to ensure statistical significance? It’s all about options and outcomes.
Frequentist versus Bayesian
There are two main approaches to defining statistical significance and evaluating A/B testing results: Frequentist and Bayesian.
Of the two, the frequentist approach is often considered more straightforward and faster to implement. The Bayesian approach is thought to provide more in-depth data.
This chart created by Dynamic Yield summarizes some of the key differences between the two approaches:
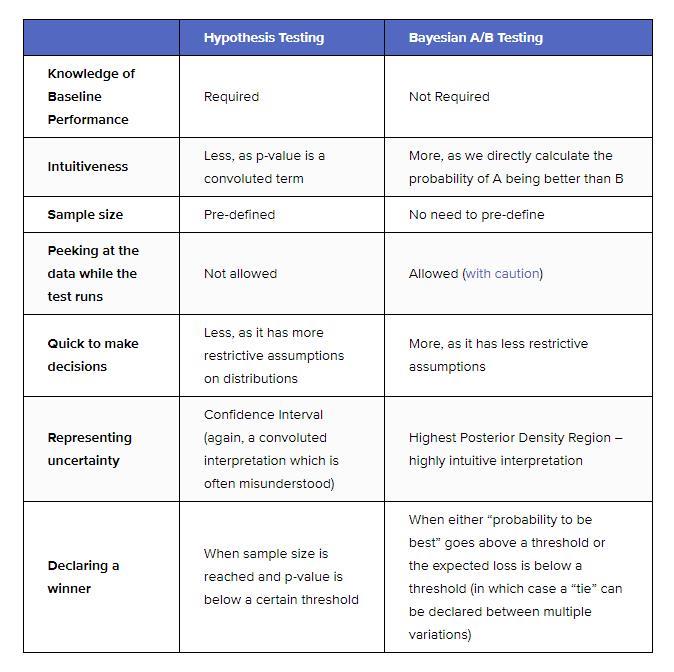
Because a Bayesian test compares the real-time data you receive to an established baseline, you have more flexibility concerning your sample size and results.
However, to maximize the reliability of your A/B tests, we still recommend that you define your sample sizes and let your tests run their course. (More on these topics in the following sections.) Among the most relevant differences between the two approaches is how the thresholds for statistical significance are determined.
Using the frequentist approach, you can prepare an A/B study and obtain statistically significant results without prior metrics to input as a baseline.
Instead, frequentist studies use confidence levels to develop a range of possibilities and a post-test calculation to define the p-value.
In contrast, the Bayesian approach requires you to input some baseline information. For example, you would input past conversion rates of similar emails to establish a baseline or range of expected outcomes. The threshold is then defined based on this range.
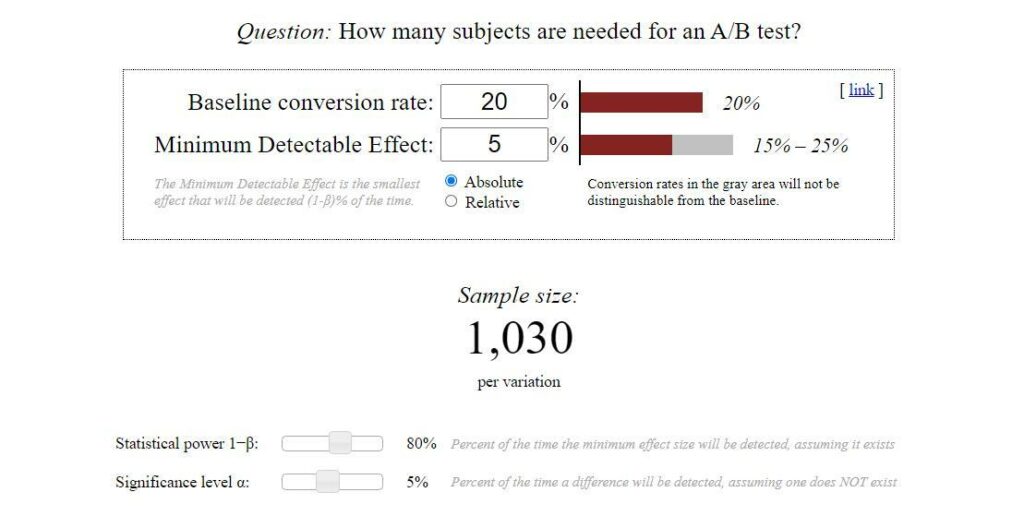
You may notice that the Evan Miller sample size calculator applies a Bayesian approach and asks for a baseline conversion rate to calculate the necessary sample size to achieve statistical significance. (Of course, you can input your best guess if you don’t have any historical data.)
In practice, you may not always know or care whether your approach is Frequentist or Bayesian. As you develop your hypothesis, you’ll rely on past data and observations and continue to build on that knowledge through your testing program.
Next up: Setting up a program that will help your email campaigns survive and thrive.
Designing your email A/B test
The purpose of A/B testing is to gain reliable data about an email’s performance. This requires planning and prioritization that goes beyond ensuring statistical significance.
You need to design tests that are practically significant as well. Meaning they are feasible to create and have a tangible impact on your KPIs.
Take your testing plans through each of the following phases to select tests that will help you grow your business, increase conversions and add to your revenue.
Pick a goal
You don’t want to waste valuable time or effort testing factors that don’t matter. So take some time to evaluate what you hope to achieve before you begin making wagers.
Start by choosing an objective. Why do you want to test your emails? The answer to this question should be your guide as you design your A/B tests.
For most of us, increased conversions are the ultimate goal. However, you have to have opens and clicks to obtain those conversions. This means you may need to start a little higher up the funnel than your CTAs.
Look at the industry and your brand’s historical data to choose your goals.
- Do your click-through rates match or exceed industry benchmarks?
- Maybe your conversion rate for some campaigns lags behind others. Or
- Maybe you want to test a crazy idea in regards to sending time.
Align your test with the objective you want to achieve.
Choose what to test
There are a lot of elements you can test to improve your emails.
You can test the content and design, your sender identity, the segment you send to, the time of day you send your message, and so much more.
I’ve separated the following list by the way subscribers interact with emails. But remember that each element is just a part of the whole that ultimately guides your audience toward conversion.
Elements that quickly stand out as a first impression include:
- Your sending identity. Is it better to send the email from an individual using your corporate name or the name of a specific product or department?
- To BIMI or not to BIMI. Could using the Brand Indicators for Message Identification (BIMI) protocol make your messages stand out and affect KPIs?
- Your subject line. Subject lines can make or break engagement, and there are several different factors that can make or break your subject line. Areas worth investigating include:
- Total word count.
- Choice of words and word order. (Do you disclose your offer or just hint at it?)
- Use of punctuation, capitalization, emojis, and personalization.
- The tone of voice.
- To emoji or not to emoji? A/B testing can answer that question.
- To create urgency or not?

- The preheader. Are you customizing your preheaders to complement your subject line? If so, you may want to test many of the same elements as you did for your subject lines. You can also test different subject line and preheader combinations.
- Google Annotations. If your emails are destined for the promotions tab, then you have an opportunity to add extra, attention-grabbing details with Google Annotations. Is it worth the effort? If so, which details will get your audience to keep reading?
- Who to send your message to. Different segments of your audience may respond differently to the same message. Your A/B testing can include audience selection as well as the content.
- When to send your message. There is no single best time to send (BTTS). Every audience is different. Use A/B testing to compare different send times to see which one appeals to your audience.
With Apple’s upcoming Mail Privacy Protection changes, testing the above via open rates alone will probably provide null results, at least for iOS users. You should figure out if you can test this via clicks and conversions.
Next on our list are elements that subscribers will identify after interacting with your emails. Test these elements to see where your emails have room for improvement:
- Your email’s appearance. Like subject lines, this category has many details that can each be the subject of an A/B test. Examples include:
- The email’s layout. Two columns or one? Mixed blocks, multiple layers, or simple text? When testing different layouts, remember that the device it is viewed on may affect how your audience responds.
- Use of color. Will you use color? How much and where? Should you stick with your brand colors or change things up?
- Images, GIFs, and emojis. Do these work for your audience? Sometimes less is more, and sometimes it isn’t. You can also evaluate different image styles, sizes, and positioning.
- The content. What you say and how you say it is critical to getting your audience to take the next step, whether that’s clicking a Buy Now button or heading to your website to learn more. Use A/B testing to get a feel for what moves your audience. What might you test?
- Copy length. Direct response letters have a long tradition of generating conversions, but does your audience have the patience for them, or should you get straight to the point?
- Subject matter and theme. Communicating with your subscribers about discounts and sales may be the obvious choice, but it’s not the only choice. Test your click-through rates for a copy that informs or shares community updates, too.
- Offer type. Speaking of discounts, what types get your subscribers to click? Try comparing a dollars off deal against a percentage discount or free shipping offer.
- Personalization and dynamic content. We regularly recommend going beyond simple personalization, such as using your subscribers’ names to create a more engaging experience. Curating content based on your contact’s previous behavior can have a major impact on deliverability.
- How engaging do you need to be to increase KPIs? Do some types of dynamic content resonate with your customers more than others?
- The all-important CTA. You don’t get what you don’t ask for. Test your CTA’s copy, appearance, style (button or text), and positioning until you come up with a sure winner.

Prioritize your testing schedule
If you have a long list of goals and elements you’d like to test, choosing where to start can be challenging. But you’ll need to set some priorities because every split test consumes some of your audience’s attention.
One way to evaluate where you should focus your efforts is to use an ICE evaluation.
This model scores potential A/B testing subjects in the following three categories on a scale of 1 to 5:
First priority: Impact
What’s the potential gain (or loss) that could be realized by making a change based on the test results? Unless your click-through rates are substandard, you probably have the most to gain by starting with conversion-focused tests.
Second priority: Confidence
Earlier I mentioned testing a wild idea. Those types of tests can pay off in a big way, but they won’t have a high confidence score. Your confidence score represents your assessment of how likely it is that your test will have an impact. In other words, what are the odds in favor of your challenger?
Third priority: Ease
This one is pretty self-explanatory. Just how hard will it be to set up this test? You can change a few words in your subject line and be ready to test in minutes. Creating an entirely new layout might take a bit longer. A low ease score (Wow, this will be hard!) can be offset by high impact and confidence scores.
Using this scoring method, a quick subject line change is probably worth scheduling as it will be easy and can lead to an immediate uptick in clicks. A test of different background colors might be a lower priority unless you are confident that the change will lift conversions.
Evaluate. Should you aim for incremental gains or shoot for the stars?
Conventional A/B testing wisdom says that you should test one variable at a time and make improvements in incremental steps. This strategy is similar to what we see in nature. Genetic changes happen as genes are tested and eliminated across generations.
Traditional, single-variable testing helps you optimize small elements of your email, working toward your goal.
This is known as pursuing the local maximum. Bit by bit, you’re gaining new insights and improving your emails’ performances.
But what if your goals are bigger?
Can you A/B test your big swings like a completely new email design?
Yes, you can.
When you create a variation representing a significant change in your strategy, you pursue what researchers call a global maximum.
When you do this type of radical testing, your incremental steps are relegated to the end of the process.
There are some downsides to this kind of approach. First, a giant swing will probably take much longer to create, scoring low on the “ease” category. Secondly, a massive change will leave you in the dark about what caused the change in KPIs, limiting your learning capabilities.
To overcome them, after you’ve identified your global winner, you can then test each element using multivariate testing and/or successive A/B or A/B/n tests.
Should you opt for multivariate testing?
Multivariate testing (MVT) allows you to combine different elements to establish which variations work best together.
For example, is it the special sauce, lettuce, and cheese that makes the Big Mac a winner, or is it the pickle onions on a sesame seed bun? Maybe it’s just the special sauce. Maybe they all have to work together?
Okay, back to emails. Let’s look at a straightforward multivariate test that considers two CTA elements, color, and placement. We want to find out which combination is a winner.
Do color and location work together, or is one element responsible for the CTA’s performance?
A bold, red CTA at the top of the copy could pull focus from the content of your email. However, placing it lower risks the reader clicking out before they get to it.
To find out, you’ll test four variations of your combined elements.
| Placement: High | Placement: Low | |
| Color: Red | Red, high | Red, low |
| Color: Green | Green, high | Green, low |
MVT can help you narrow down your options before you finalize your results with A/B testing. However, because you are testing more versions of your email, you’ll need a larger test audience, and it will take more time to complete your test.
While you can achieve significant improvements through A/B testing, keep multivariate testing in mind for those times when you want to go big.
Identify the metrics you want to track
You know what you want to test and why. Now, how will you measure the results? Your metrics for each A/B test should be directly linked to your goals for that test.
If your goal is to improve CTR, then you’ll look at the CTR of your test emails to choose a winner.
In most instances, your deciding metric will be the email’s click-throughs or conversions. But, you don’t have to stop there.
Collect multiple streams of data from each A/B test to maximize your knowledge and your ROI. The following data will help you build better emails:
- Delivery. Did the emails you sent reached the mailbox or bounced back?
- Inbox placement. Did the emails you designed make it past ISPs’ filters, landing in the inbox?
- Click-through rates. Did you get the clicks you expected? If your email included more than one link, which one drew the most attention?
- Conversions. How well did the control and alternate email perform the task of getting subscribers to take your desired action?
- Post-open engagement by segment. If your sample group included subscribers from different segments, was there a difference in their responses in terms of clicks and conversions?
- After-open rejection rates. Did some of your sample set unsubscribe after receiving the control or alternate email or mark it as spam?
Combine the data from your A/B testing with a powerful email analytics module. Having a clear understanding of the results is a must if you are to level up your email campaigns fast.
Executing your email A/B test
After you’ve mapped out your A/B testing schedule and general design, it’s time to build your first test. To do this, you’ll need to:
- Create a set of emails to compare.
- Choose your audience segment.
- Designate a sample size.
- Define “winning”.
- Decide when to send your test.
- Select the test’s duration.
- Evaluate the results.
- Share your data and apply what you’ve learned.
- Continue testing and validate your results.
I’ll walk you through those steps in the following sections.
Create the control and alternate emails
After setting up your test parameters, you are ready to create the control and alternative emails that you’ll use to test your hypotheses.
Your control and alternative should be nearly identical except for the factor you’ve decided to test. So, if you want to find out which CTA copy gains the most conversions, you can only alter the CTA in email. If you change the CTA copy and the subject line, you won’t know which change made the difference.
Can’t stop at just two choices? That’s okay.
Unlike a true null hypothesis, your choice A doesn’t have to represent the status quo. For example, you might compare two CTAs that you’ve never used before. If you go with entirely new content, you’ll miss out on the chance to compare your results to an existing benchmark. But you can record your data and use it as a new benchmark going forward.
You can also use A/B/n testing to compare several alternatives against one another or an incumbent. This type of test would be appropriate if you wanted to try out three different from name options (individual, company, and product) or several different CTA button colors.
Using Ongage, you can test up to 10 different email variants at once. Just keep in mind that as your number of alternatives grows, so does the minimum audience you’ll need to conduct your test. Analyzing your results gets more complicated too. We recommend trying out four or fewer alternatives for most tests.
Strike with a big hammer
The less impactful your change, the harder it will be to detect. In A/B testing terms, a more easily detectable impact can improve the power of your test. So we recommend going big.
For instance, if you want to find out whether offering a discount increases conversions, make it an offer subscribers are sure to notice.
If you try a 10% discount vs. no discount and find no difference, you won’t know whether the lack of reaction is because 10% isn’t enough of an incentive or because people don’t care for discounts.
This offer from NuGo has a lot of limitations that might muddy the results in an A/B test.

On the other hand, if you go for your upper limit – say, a 50% discount – and still don’t see a change, then there’s a good chance discounts don’t sway your customers.
You still have options, though.
If your testing goals force you to go with a smaller difference, you’ll need a larger sample size and/or a longer test interval to reach your desired significance level.

Select your sample size
This step is critical to the success of your A/B testing.
How many people should get each email variant?
Evolution hates a small gene pool, and A/B testing hates a small sample size. Like Goldilocks, you want to select the sample size that is not too big, not too little, but just right.
The more people in your sample, the closer you will understand how your variables will perform in real life. A larger sample will be more diverse and less likely to include only people with the same likes and dislikes as by coincidence, reducing your chances for a Type II Error.
Your results will be more statistically significant.
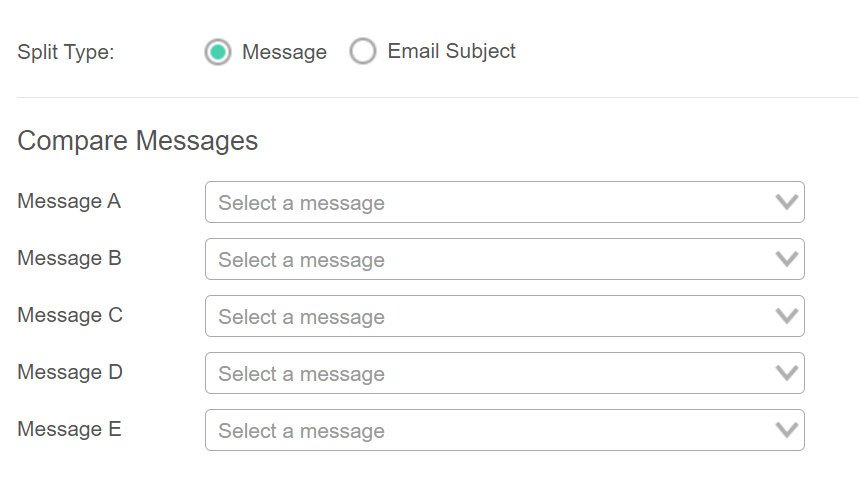
How big should your sample size be? It depends on various factors. Your best bet in determining it is by inputting these variables into a calculator like this one from Optimizely to help you choose.
Here’s what your input will look like:
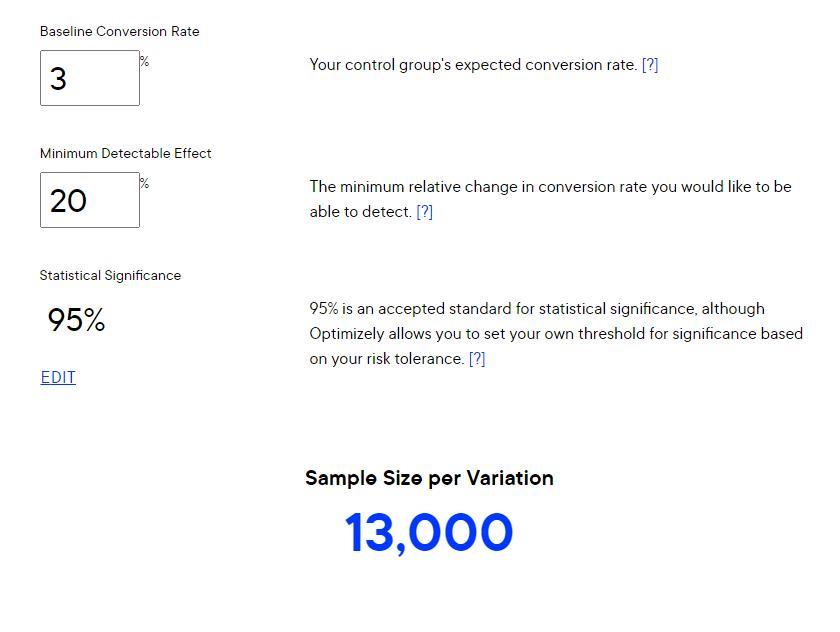
Once you’ve determined your sample size, you can easily create the segments and audience you want to target.
Choose the audience segment or segments to test
Your sample groups for each email variant you want to test (including the control) will need to represent the audience you want to target with the winning email.
Do you want to test your email variant’s effectiveness with a single segment, such as subscribers within a certain age range or geographic area? Or do you plan to test the email with your entire subscriber list?
You can also choose to run the same A/B test independently with separate segments.
Whatever choice you make, you want to send your test emails to engaged subscribers. Your results won’t be reliable if your emails don’t reach subscribers’ inboxes and get their attention.
Avoid getting bounced or ignored by defining a sample segment that includes subscribers with a minimum level of engagement.
Be careful not to narrow your selection criteria too much, though. If your pool of candidates is too small, the resulting sample group may not truly represent your audience, which will skew your results.
Define what it means to win
What’s a win look like? For your A/B test, you get to decide.
This decision will be different for each test and guided, in part, by your significance analysis. But you should conduct a cost-benefit analysis as well. A win doesn’t evolve your email program if it is too difficult or expensive to implement.
For example, a 1% improvement in click-throughs may be significant and a winner for a single campaign change. However, if the cost of implementing this new strategy across all your emails is greater than the revenue it generates, you probably aren’t going to adopt it.
In these instances, your win should be a percentage of improvement significant enough to justify the cost of making the change.
In other instances, you may already strongly favor making a change as part of a rebranding or other initiative and just want assurances that it will not harm.
In that case, a draw, where the alternative merely matches the control, maybe enough to declare B the winner.
Minimum Detectable Effects and email A/B testing
Minimum Detectable Effect (MDE) is a metric you can use to define what it means to win.
It is the smallest impact you want or need to see to declare your alternative hypothesis the winner. Some researchers suggest calling this metric the “Minimum Effect of Interest” instead because it represents the minimum impact you care to know about.
Any effect lower than your MDE is discounted as non-valuable or “noise” because it won’t change your opinion about the value of A or B.
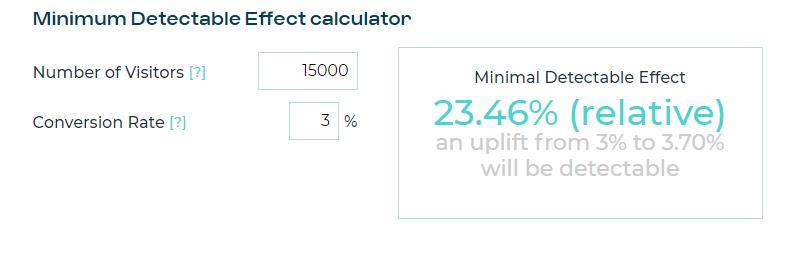
Many sample size calculators will ask you to enter the (MDE) for your A/B test because both effect and sample size influence a test’s accuracy.
Suppose you can’t decide where to set your MDE for a particular test, no worries! Check this by AB Testy MDE calculator – it will help you come up with this number.
With all these decisions out of the way, you’re almost ready to hit send and begin your test.
Select your test’s send time
Unless your A/B test is intended to weigh the value of different send times, you should try to ensure that every member of your sample set receives your email simultaneously. This reduces the chances that the time of receipt affects your results.
Further, don’t just consider the time of day when deciding when to conduct your test but also the day of the week.
Remember, you want to walk a delicate balance between getting as much data as possible while maintaining consistency. If you usually send your weekly newsletter on Mondays at 9 am and plan to test a new newsletter format, conduct your test on a Monday at 9 am as well. Otherwise, you’ll have issues comparing your results with previous ones.
Decide on a duration for your test
It can be enticing to decide you only need two hours to test your new email and send the best variation to your entire list. It might be accurate, but ultimately, it’s not up to you.
The sample size calculation determines the test duration and how quickly subscribers interact with your emails. If you have a large sample size, you need to go through and test conversions. You may have to wait a couple of days to get data-driven conclusions.
It ain’t over ‘til it’s over
Test duration is one of the factors that influence the accuracy of your test results. So, once you’ve set an A/B test’s run time, it’s best to let it run.
Avoid the temptation to declare a winner as soon as you start to see one variant pull ahead. Rushing to a conclusion can cause you to draw an incorrect one.
Metrics don’t arrive at a neat and even rate. Maybe your early email openers had a distinct preference that later openers didn’t. Plus, an early call reduces your sample size by cutting off late openers. You set your duration and sample size for a reason. Stick with your decision.
Keep this in mind the next time you run a “real-time A/B winner” test.
Evaluate your results
Once your test has run, you’ll have some data to explore. You can look at the performance of both the winning and losing emails to get insights into how your audience responded.
If you’ve found a significant difference between variants, you may want to send it to your entire list. Then, you can compare the email’s “full list” performance against its performance with your sample group.
Did the full mailing perform as expected?
If not, you may want to investigate whether a Type I or Type II error occurred and look for other variables that might have caused the difference.
You’ll also have the other metrics you collected. Add these to your data repository, so they are accessible to other teams in your organization to expand your knowledge base and your competitive advantage.
One final significance check
Before changing your email strategy based on this new data, though, you probably want to be sure your A/B test produced statistically significant results.
You can check up on your test’s relevance by performing a t-test comparing the mean for each of your variants. This test is conducted after the fact and uses the actual performance of each email during the A/B test.
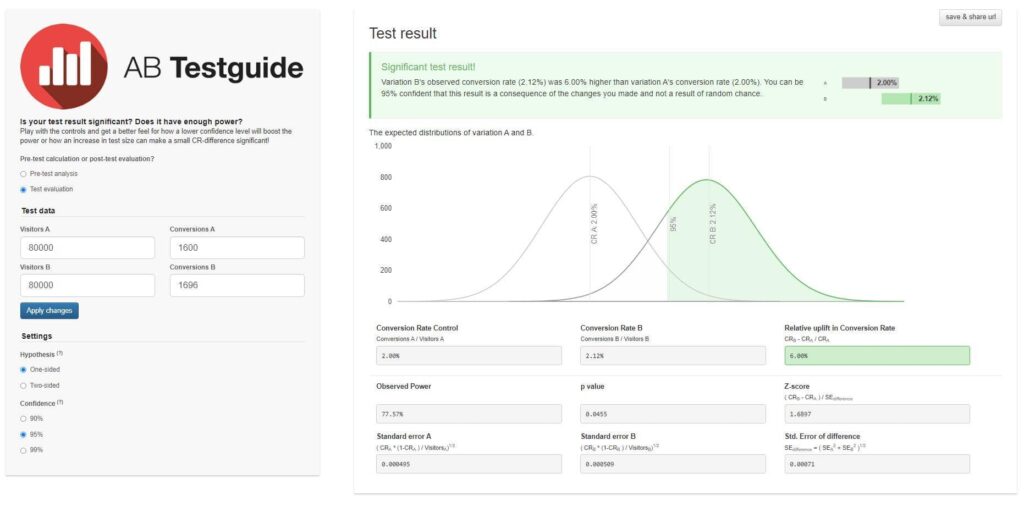
This 2 Sample T-Test calculator can help you check your post-test results. Or, try out this pre-and post-test evaluation tool from AB Testguide.
If you conducted an A/B/n test, you’d need to use an Analysis of variance (ANOVA) test for your post-test evaluation. A one-way ANOVA test can compare three or more data sets and identify the relationships between them.
This One-way ANOVA calculator from Social Science statistics can help you complete your analysis.
Apply what you’ve learned

You had an idea, you tested it, and now you have the results. Now, it’s time to use the information you’ve gained to advance your email campaigns to the next level.
Will you make a change or stick with the status quo?
Continue to observe the performance of emails that implement any changes (and those that don’t) and use this information to decide whether the test strategy should be extended to other email campaigns or audience segments.
As you continue to implement changes, record your observations. As always, share this information with the rest of your organization so they can learn more about your audience’s unique preferences, too.
Continue performing new tests and revalidating past results
One thing you can be sure of as an email marketer is that consumer behavior is constantly changing. Keep working through your list of email A/B testing priorities to stay on top of your subscribers’ preferences.
Also, keep track of your past winners and losers. What didn’t work last year might be a winner now. To make sure you aren’t missing out on opportunities to increase your revenue, pull out your past email tests and rerun them to revalidate and update your findings.
And, if you need help deciding what to test next, pay a visit to the Ongage blog. We write about the latest trends in email marketing in articles like this one about how to take your email personalization beyond just naming names.
Let’s summarize your email A/B testing best practices via a quick list
- Isolate a single variable for each test.
- Select random sample groups from your active subscriber list.
- Make sure your null hypothesis is clear and based on sound observations.
- Use adequate sample and effect sizes to ensure statistical significance.
- Don’t stop your test early.
- Use post-test evaluations to validate your test results.
- Incorporate regular A/B testing into your email marketing strategy.
Happy A/B testing to all us humano hoc probat!


 Academy