


When you lose customers through attrition, you lose opportunities for growth. Customer attrition costs you revenue and time and increases your total acquisition costs. Are you doing all you can to keep the customers you worked so hard to acquire? Find out how to define, detect and deter customer attrition in this article.
The cycle of life is one of continual loss and replenishment.
A plant dies, and another spring up to take its place. One species’ influence fades, and another gains dominance. When an imbalance erupts, natural forces go to work to restore that balance.
The cycle of your business follows similar patterns.
To survive and thrive, your organization must maintain a constant process of adaptation, renewal, and replenishment.
Like a farmer maintains their orchard, you must carefully cultivate the customers under your care, building relationships and maximizing customer value from first touch to last.
This is the secret to good harvests and continued growth.
Your email marketing program is an indispensable tool for optimizing your performance at every stage in your customer lifecycle and reducing customer churn.
In this article, I’m going to explain how to identify, monitor and reduce customer attrition – one of the most important KPIs to monitor – and detail how to use email marketing to support retention-focused campaigns that keep your customers coming back.
What is customer attrition?
Customer attrition is the term used to describe individuals or business entities that previously purchased a product or service from your organization but now don’t. In the simplest form, we use the term to describe lost customers.
Customer attrition measures mid- and bottom-of-the-funnel leaks–buyers who entered your funnel and converted before they left.
Depending on your business model, the “customer” in customer attrition may mean user, customer, client, or subscriber–whatever word you use to describe the people who buy your goods or services.
The opposite of customer attrition is customer retention, or how many existing customers you keep.
Like attrition rates, we usually calculate retention rates for a specific interval. A separate metric, “repeat customers,” assesses how many customers purchase from your brand more than once.
Each of these measures can serve as a valuable key performance indicator (KPI) to guide your brand’s growth strategy.
Customer attrition vs. customer churn: Is there a difference?
The terms customer attrition and customer churn are often used to refer to the same concept: The loss of a customer.
However, these terms may also distinguish between gross attrition, which indicates the total attrition rate regardless of new customers gained during a specific interval, versus net attrition which reflects your net losses. (More on how to make those calculations later.)
Where your organization uses both gross and net attrition metrics, you might use the term churn rate to indicate your net figures.
What causes customer attrition to happen
There are many ways for a crop to fail. Bad seeds, drought conditions, storm, or insect damage can all take their toll. Throughout a single season, different threats dominate. A careful farmer understands which risks are greatest at which times and makes plans accordingly.
I bet you know where I’m going with this, right?
Your seasons are your buyer’s lifecycle.
There are a lot of reasons you might lose a customer at any stage the marketing lifecycle, but some of those reasons are more common than others.
For example, immediately after your customer’s first purchase, failed product/market fit, poor messaging, or unsuccessful onboarding are most likely to cause your customer relationship to wilt.
A repeat customer who started off strong but then loses interest may be disappointed with the ongoing value of your product or your customer support services.
They may also withdraw because you took them for granted by failing to show your appreciation after a few early interactions.
Even a formerly loyal and appreciated customer may wander away if another competitor tempts them with a new product or product feature or a great deal.
Perhaps a simpler way to look at it is to say that brands lose customers for two main reasons:
Bad products or bad customer experience.
Of these two, it is the latter that you have the most ability to influence post-purchase through effective email onboarding campaigns and other communications. Once the seed is planted, it is your customer experience performance that decides whether it will thrive.
The attrition and churn rates you calculate won’t indicate which type of loss is responsible for your results. But you’ll need to uncover these details to develop effective strategies for combating attrition.
Start by identifying whether you are losing customers through voluntary or involuntary attrition.
Here’s the difference between those two types of attrition:
Voluntary attrition occurs when a customer chooses to stop purchasing your product or service. They may have found a better price or decided they don’t want your product or service anymore. Whatever their reason, their choice is intentional.
When voluntary attrition happens, you may have an opportunity to win back the customer by addressing their concerns or objections. You can also use their feedback to guide your future anti-attrition efforts.
Involuntary attrition happens when the relationship ends because of circumstances external to your business relationship or outside the customer’s control.
For example, if you end a subscription contract because the customers’ payment fails when their payment fails, the customer moves to a location outside your service area, or they experience a health or other event that prevents them from continuing to do business with you.
Your organization has more opportunities to influence voluntary attrition and reduce customer churn, particularly through your marketing and sales communications. However, you may also reduce involuntary attrition by addressing the root causes.
For instance, if a significant percentage of your customers are moving outside your service area, it may be time to extend your territory or add regional partners. For customers struggling to make large payments, offering a payment plan or different payment processing options can help them and you.
📧 Online department store HSN woos previous customers with a newsletter highlighting its flexible payment options
In an aggregated report about consumer spending habits, RetailDive shared stats from Visa indicating 82% of small or micro-businesses now offer digital payment options.
The report also cited an Experian study which found that 80% of consumers use installment payment services and 57% are eyeing buy now, pay later (BNPL) options to avoid incurring credit card debt.
Now, before I explain how to calculate your attrition rates and what you can do to reduce them, I should probably explain what attrition matters. Is it really a big deal? Find out next.
Why is tracking customer attrition important?
What impact does customer attrition have on your business’s ability to survive and thrive?
The verb “attrit” means to wear down, weaken or erode. The meaning of this root word for attrition is highly à propos because unchecked customer attrition will weaken and erode your business. It’s a growth killer.
When your business loses a customer, it loses the investment of time and resources used to gain that customer and the opportunity to recoup those expenses. This increases your average customer acquisition costs (CAC) while lowering customer lifetime values (LTV).
Preventing attrition enables you to continue growing as a business instead of standing still.
Imagine an orchard that has 1,000 trees planted. If those trees are well cared for and productive, the orchard’s owner can invest their time and money in expansion, planting 100 new trees. Then, as those trees flourish, the farmer plants 100 more. Soon, they have an orchard with 2,000 trees.
But what if 100 trees die of neglect for every 100 new trees planted?
The grower’s investment gains them nothing. In fact, the grower may experience negative ROI because they weren’t able to harvest enough fruit from their neglected trees to cover the costs of planting them.
Customer attrition results in indirect or opportunity costs, too.
Personal recommendations, testimonials, and referrals from loyal customers are among your most powerful tools for attraction marketing as a way to convert new prospects.
New customers seldom offer the same value as repeat customers as advocates.
Nurturing your most loyal customers can significantly reduce your CAC and supply you with a steady stream of new buyers.
Finally, your customer attrition rates can give you meaningful insights into the health of your customer acquisition funnel. Use this data as a starting point to investigate at what point your customers are leaving your funnel and why.
- Do your customers leave (or not return) after a single purchase?
- Are you losing repeat customers after several months?
- Has there been a steady rise in your churn rates or a sudden increase?
Tracking your attrition rates helps you prevent erosion that depletes your resources and steals your strength.
What if your business doesn’t earn revenue directly from customers?
When your customers aren’t the source of your revenue, or your revenue per customer is highly variable, you may choose to track revenue churn, and compare revenue and customer churn rates to better understand your business’s growth trajectory.
What is a good customer attrition rate?
Is there a good customer attrition rate?
Usually, you want your attrition rate to be as low as possible. Even though you can’t avoid all attrition, every attrition point has an impact on your growth.
Annualize a 5% monthly churn rate, and it equals losing approximately 43% of your existing customers every year. That 5% leak in your funnel becomes a huge drain on your resources, as you have to replace more than 40% of your customer base just to maintain the status quo.
Losing some of your customers is an expected part of the business cycle, and not all customer attrition stems from the same source.
Customers change jobs, move to new cities, develop different interests, or have a need for something you don’t offer. Sometimes, but hopefully not often, your customers leave because you let them down somewhere along their buyer’s journey. It happens.
Keeping your customer acquisition pipeline flowing and expanding your revenue opportunities from the customers you keep is your hedge against these losses. Understanding how and why a customer is lost will help you craft better strategies for prevention.
There may be times when losing a customer isn’t so bad, though.
Stick with me here.
If your customer attrition rate represents the shedding of low-value or negative-value customers, then it can be a good thing. Sometimes brands intentionally shift their attention from one market segment to another as part of a growth strategy.
It’s like the vintner trims their vines to strengthen them for better yields in the future. Or you embracing the unsubscribe to shed subscribers who consume your email marketing program’s resources without generating revenue.
Of course, if you’re trying to lose unprofitable customers, you’ll need to segment your churn analysis to account for this fact. Your analysis should calculate the attrition rate for your ideal customer segments and the ones you’d rather do without.
Learn several methods to calculate your customer attrition rates in the following sections.
How to measure customer attrition and customer churn rates
In modern business practice, customer attrition is often used interchangeably with the terms as customer turnover, churn, cancellation, or defection, particularly when referring to their related metrics. For example, you may report an attrition rate that represents existing customers lost offset by new customers gained.
However, a raw or gross customer attrition rate is slightly different.
This metric represents the number of customers lost as a percentage of your total customer base. The rate of loss is usually measured for a designated period, such as monthly, quarterly or annually.
I’ll show you how to calculate each. But first, I need to explain some of the variables you’ll be using to make your calculations.
Setting your churn terms: Define your formula variables before you calculate attrition
According to Profitwell’s Patrick Campbell, there are over 40 different calculations being used by public SaaS companies to calculate their retention rates. That’s because every company is unique, and so is the way they define the variables they use to calculate their metrics.
Alleviate confusion and ensure that your metrics are actionable by developing a shared understanding of your metrics’ formulas and how variables are defined.
For example, when you say “attrition,” do you mean gross or net? Also, what’s the standard time period that each metric covers unless otherwise stated?
Avoid costly and time-consuming misunderstandings by publishing your standards for each formula and variable in your company’s knowledge hub or single-source-of-truth repository.
Here are a few issues you’ll want to get ahead of to keep your analytics flowing smoothly.
🧮️ Define what a “customer” is for your business
To calculate your raw or gross attrition rate, you need to determine how many customers you lost during the designated calculation window. This requires defining what it means to lose a customer.
First, though, your team has to agree on what you mean by a customer.
Business models that incorporate free trials, freemium or other offers that represent activation but not revenue, two-sided networks, or ad-based revenue may not define customers as only those who generate revenue directly.
In those cases, a customer may be distinguished from a non-customer by their registration status. Those who sign up for an account are customers, while those who don’t aren’t.
In general, your organization’s customers are the individuals or business entities that have completed the customer activation or conversion event you’ve defined–similar to how you define these signals when calculating attribution windows.
Of course, how you define what a customer is will guide how you identify a customer as lost.
And some types of loss are easier to spot than others.
🧮️ Decide what events signal a lost customer
How you define what a customer is will guide how you identify a customer as lost. And some types of loss are easier to spot than others.
If your customers purposely defected, identifying them is easy.
Active attrition occurs when a customer takes some affirmative step to leave you. They may have closed their account or canceled their subscription. Subscription churn is another way to describe this loss of a recurring fee.
You can compare active attrition to email users who unsubscribe to your messages or visit your preference center to opt out. They have to do something to end the relationship, and you’ll know when it happens. Active attrition is easier to detect and monitor than passive attrition because your customer (or their payment processor) informs you when they leave.
But what about customers who don’t notify you about their intentions?
How long do you wait for a customer to come back before you consider them lost? And what about customers who continue to hang around but don’t purchase your products or services? Do you add them to your attrition totals?
Deciding what is or is not a customer can be especially difficult for digital products or services or freemium revenue models. For example, if your app rewards “attendance points” each time a user logs in, are those logins counted as active users?
Passive customer attrition is the term used to describe these lost-in-limbo customers. Similar to your email subscribers who remain on your list but are inactive and unengaged (a.k.a. “Invisible” or “passive” email churn), they’re there, but they aren’t contributing to your revenue or growth.
When no product or service purchases are involved, you may call this type of loss non-subscription churn. And if your lapsed customers boomerang back to you? You can call it rotational churn.
You won’t know exactly when these customers decide to leave and may not notice their departure immediately. This type of attrition can sneak up on you if you aren’t tracking your metrics consistently.
How do you detect passive attrition?
Identify your lost versus retained client by defining both your retention or active customer event and how often the event must occur.
Conduct order gap analysis, identify your customers’ average purchase frequencies or average order cycle, and evaluate other historical data to decide how much time should pass after a customer misses this milestone before you consider them lost.
This information will not only inform your identification of lost customers but also feed your predictive analytics for stopping losses.
If you sell a consumable item that your customers usually replenish every three months, you might consider a customer at risk for churn at 3.5 or 4 months and churned at the 6-month point.
In contrast, if you offer a service such as mortgage lending or recruitment, that customers use at irregular intervals, then you may need to develop several models to pinpoint your customers’ use frequencies.
Be careful not to over-or underestimate what period should trigger a churn determination. Test several calculation windows and thresholds and compare the results to figure out the thresholds that provide you with actionable data.
🧮️ Choose the intervals you’ll use to measure attrition rates
Attrition rates are measured over a specific period, which you’ll need to choose before plugging variables into your formula.
The suitable interval to measure your churn will depend on your customer lifecycle and your business objectives. You can use more than one period of measurement to track both short- and long-term performance and make comparisons between the two.
And you can adjust or add intervals to meet your changing data needs.
For example, you might want to watch your churn rates closely after introducing a new product feature or discontinuing a service.
A sudden drop in customers may indicate they weren’t happy about a recent change. Meanwhile, a surge in your retention figures is a signal that you got something right.
🧮️ Choose the customer total metric you’ll use in your attrition formula
When calculating churn, you divide your lost customers by your total number of customers (making your total customers the denominator in the churn formula). But where (or when) does that total come from?
Yes, there’s more than one option.
Some organizations use a formula that defines the “total customers” variable using the number of customers at the end of the period, while others use the beginning of the period total.
The total you use for your formula denominator will affect your final results with a larger spread between your beginning customer total and ending customer total, causing a greater divergence between the two.
I’ll share the full details of the formula in the next section. In the meantime, here’s a preview of how the choice of denominator can affect your results.
If your farmer has 10,000 trees at the beginning of the period and 12,000 at the end, his “lost customers” total would be the period’s beginning customer total – end customer total. When the net customer total represents a gain, that makes the attrition total a negative number, or negative 2,000, in this scenario.
Using the BCT denominator, the results work out like this:
-2000 ÷ 10,000 x 100 = – 20% attrition rate
Woot! That’s negative churn or a 120% net retention rate.
Using the ECT denominator, the results work out like this:
-2000 ÷ 12,000 x 100 = – 16% attrition rate
Eh, still looking good.
What if our farmer lost more trees than he gained?
A starting total of 10,000 trees and an end-of-period net loss of 8,000 trees would look like this with the BCT denominator,
2,000 ÷ 10,000 x 100 = 20% attrition rate
And like this, with an ECT denominator,
ECT: denominator: 2,000 ÷ 8,000 x 100 = 25% attrition rate
A compromise solution is to use a “captured churn” formula which averages your customer total based on the first and last days’ numbers.
Another alternative, known as the “Shopify formula,” calculates the denominator by averaging the customer totals from each day in the period to arrive at an average customer total for the full interval.
Which formula should you use?
The denominator your organization chooses matters less than making your pick and sticking with it. You don’t want to be comparing apples to oranges when assessing your harvest.
Speaking of comparing apples to oranges, join me for a tour of the differences between gross and net attrition rates.
Getting the raw data about lost customers: Calculating gross customer attrition
The gross attrition rate formula is a simple calculation of true attrition–customers present at the beginning of the period that were lost by the end of that period.
For instance, if you had 1,000 customers at the beginning of Q1 and lost 150 of those customers by the end of Q1, your gross attrition rate would be 15%. If you lost 150 existing customers and gained 250 new customers, your gross attrition rate would still be 15%.
When you use the same foundation for calculating both attrition and retention, the two rates should equal 100 when combined. The gross retention rate for this Q1 example would be 85%.
This formula, which doesn’t take into consideration the period’s customer acquisitions, is a lagging indicator for product-market and message market fit and your brand’s customer success performance.
If your gross customer attrition rate is on the rise, investigate:
- Whether your product is meeting the needs of your target customer. Look at your buyer personas to help you identify who you’re selling to. Is your current audience the right match for your product?
- Whether your sales or marketing practices are setting reasonable expectations. Are you delivering what you’ve promised?
- Whether your post-purchase support is adequate. Are new customers successfully onboarded and nurtured? Does your product or service have a quality issue?
It also pays to keep a close eye on your competitors. A rising attrition rate may indicate that a new competitor has entered the market or an existing competitor is upping their game.
As you’ll discover in the next section, net attrition and retention rates tell a different story. Net attrition rates are the metric that you are most likely to find if you are researching customer attrition or churn.
Bottom lining your funnel performance: Calculating net attrition or customer churn rates
Understanding net attrition or churn rates hinges on understanding a key factor used in the metric’s formula: Lost customers.
The gross attrition formula defines lost customers as existing customers who attrited during the period.
For net calculations, this term’s definition changes to a net end-of-period customer total that subtracts customers lost and adds customers gained–regardless of how or why those gains or losses occurred.
This formula is more closely aligned with the terms churn or turnover–as you are measuring losses and replacements, not just losses.
Calculate the lost customer variable for a net attrition rate with the following formula:
Customers at the beginning of the period – customers lost through attrition during the period + customers gained through acquisition during the period = ECT (a.k.a. net customer loss or gain)
To get your attrition rate, divide the result by your chosen denominator with the result multiplied by 100 to get a percentage.
The full formula is
Beginning customer total – end customer total ÷ Beginning customer total x 100 = attrition rate
or
Beginning customer total – end customer total ÷ Ending customer total x 100 = attrition rate
The shorthand version looks like this:
(BCT – ECT) ÷ BCT x 100 = attrition rate or (BCT – ECT) ÷ ECT x 100 = attrition rate
How does calculating net losses instead of gross affect this output?
For both the gross and net formulas, the BTC remains unchanged at 1,000 customers. However, the end-of-period total could change substantially depending on the success of your customer acquisition tactics during the period.
For example, if you lost 150 customers and gained none, your attrition or churn rate would be 15% using the gross or net formulas.
But if you lost 150 customers and gained 250, your net attrition rate would be -10% (compared to 15% using the gross formula). That’s a pretty significant change.
Unlike the gross attrition figure, the churn rate tells you about the aggregate performance of your customer acquisition funnel–from conversion to retention. This KPI is useful for tracking performance across and between periods and identifying patterns.
But using churn rate makes drilling down to identify issues and find solutions more difficult.
A farmer who loses their entire crop has a cultivation and care problem–regardless of how many new trees they planted. A farmer who is only losing and replacing a few trees each season isn’t poised for expansion.
When evaluating positive or negative attrition rates, look for trending patterns or abrupt changes. Then, conduct customer attrition analysis to find out which of the numbers you plugged into your formula is impacting the outcome and how.
How to use churn signals to predict customer attrition
Attrition and churn rates are lagging indicators of your customer retention performance. These numbers tell you what you’ve lost.
But you don’t have to wait for these figures to come in to take action against attrition.
Like a good caretaker studies their crops and looks for signs of trouble, you can survey your data for churn signals to predict and prevent attrition.
By combining predictive measures that tell you when a loss is imminent with diagnostic measures that tell you why your customers are leaving, you can minimize the impact of customer churn on your business.
Use churn analysis to identify which customers are leaving and why they are leaving, and uncover the leading indicators that can alert you to future defections.
Learn to recognize the signs of at-risk customers with the help of email analytics, such as low click rates, and implement preventive measures to save those relationships.
You won’t be able to spot and prevent every attrition. But you will be able to reduce your attrition rates and gain information to improve your customer experience and future performance.
What data points should you use to detect potential problems? While every business is different, there are some common signals that can offer clues to your customers’ intentions.
There’s no foolproof way to predict human behavior. But there are methods and metrics that get you close to the mark. Use these quantitative and qualitative behavioral barometers to anticipate your customers’ next moves:
Recency, frequency and monetary (RFM) analysis
RFM analysis is useful for segmenting your customers and predicting their future behaviors. As a segmenting tool, brands use RFM analysis to group customers by value and develop customized marketing strategies for different cohorts.
Customers who purchase more often and at high order values have the highest lifetime value potential. The analysis of recency gives brands clues about the customer’s loyalty and engagement.
A larger than usual gap between purchases, a drop in contact after the last purchase or a reduction in a customer’s average order value can all signal dissatisfaction or defection. Is your customer trying out a new vendor? Or is there some other reason they’re purchasing less from you?
Once you have established RFM benchmarks, you can automate the process of detecting variances and implementing retention measures such as re-engagement email campaigns.
Adoption, use and repeat purchase rates
Making the sale is just the first step toward customer retention. Can you make the second sale or keep the user as a subscriber?
If a purchaser isn’t able to figure out how to use your product or service or finds no value in it, they’re unlikely to remain your customer for long. If your product is an app, does the user login regularly? If you sell consumable items, are you customers ordering replenishments?
Customer sentiment analysis
Customer sentiment analysis covers a wide range of inputs, from assessing unstructured feedback for positive and negative sentiment trends to conducting net promoter score (NPS) or other voice of the customer surveys.
Other ways to find out what your customers really think about your brand and its performance include conducting one-to-one follow-up calls and polling your customer support team members.
Support tickets, return rates, and third-party rating sites can also provide early warning signs about your customers’ intent.
Competitor research
Sometimes it’s not you; it’s them.
Not your customers “them,” but your competitors. You may be the ride-or-die choice for 50% of your market one quarter, only to be replaced by a new love the next.
Keep a close watch on your competitors’ pricing, positioning, and product strategy and how consumers are responding.
Non-purchase customer behavior and engagement metrics
RFM analysis looks solely at your customers’ purchase behaviors. But your customers’ other behaviors can tell you a lot about them as well. Evaluate your customers’ non-purchase behaviors and engagement across all your channels.
Identify each customer’s preferred channels and use this information to create segments that you can monitor to detect disengagement or other channel-specific changes.
What does your website traffic look like, and have the main sources of traffic changed? Are your email click-to-open rates remaining steady or increasing? Do your customers follow you on social media?
Coordinate your email marketing platform’s engagement data with your CRM or other customer data platform and any other information you can access to build a 360-degree view of your customers. The more data you can put together, the better you’ll be able to detect potentially painful patterns.
Customer lifecycle analysis
At every stage in your buyer’s journey, from awareness to advocacy, different behaviors offer clues to their status.
Are they abandoning the journey, moving forward, or stuck in place?
Define the key indicators of progress or stagnation for each of the stages in your buyer’s journey and use these to monitor the health of your customer acquisition and retention efforts.
Post-departure customer data
When a customer actively cancels their relationship with your brand or simply fades away, ask them why. Develop scripts to guide your customer support team to attempt to recover failed relationships and get useful feedback, even if they don’t succeed.
You can also send post-cancellation surveys or follow up with an “exit interview” phone call to find out what your brand could have done differently (if anything).
For passive departures, develop a systematic process for identifying when to make contact to get feedback. Information from defectors and detractors can be a fruitful source of intel for making retention-boosting improvements.
Use this data to pinpoint where and when you are at the most risk of attrition, then prepare your countermeasures.
How to use your email marketing program to handle customer attrition
Reducing customer attrition enables you to focus your customer acquisition resources on expansion rather than survival.
As your customer base widens, you gain additional revenue to support growth and hedge against market downturns.
By implementing a strategic process of renewal and replenishment, you secure your market position and keep encroaching competitors at bay.
So what can you do proactively to reduce the incidence of churn and react to the churn signals you detect?
If bad products and experiences trigger a stampede for the exits, good products and positive experiences have the opposite effect.
I’m an email marketer, so I’m going to focus on how you can use email to nurture strategies to maintain strong customer relationships at every stage in your funnel.
But always keep in mind that your customers are omnichannel consumers. They expect you to meet them where they are and deliver consistent quality at every touchpoint.
Deliver superior customer experiences end-to-end
Your customers’ experiences at every stage in their journey influences how they feel about your brand. A 5-star experience makes customers 3.5 times more likely to purchase more with your brand than a 1- or 2-star one, according to a survey by Qualtrics.
How you engage with them as prospects and after their purchase, the UX of your website, the accessibility of your emails–everything you do adds to or detracts from your standing.
Fail to deliver your best at any level and the results can be costly.
Qualtrics’ survey also found that more than half of customers will stop or reduce their spending with a brand following a bad experience with it.
As part of ensuring a positive experience from end-to-end, engage in two-way conversations with your customers. Invite them to join your email subscription list and send email campaigns that offer value-adding support and advice, and ask for their feedback.
When communicating with your customers via email, give them a way to talk back–don’t use a “noreply” email that leaves them locked out.
Transactional emails have amazing potential to demonstrate your dedication to customer experience. Use these messages to keep your customers in the loop about deliveries and stock levels.
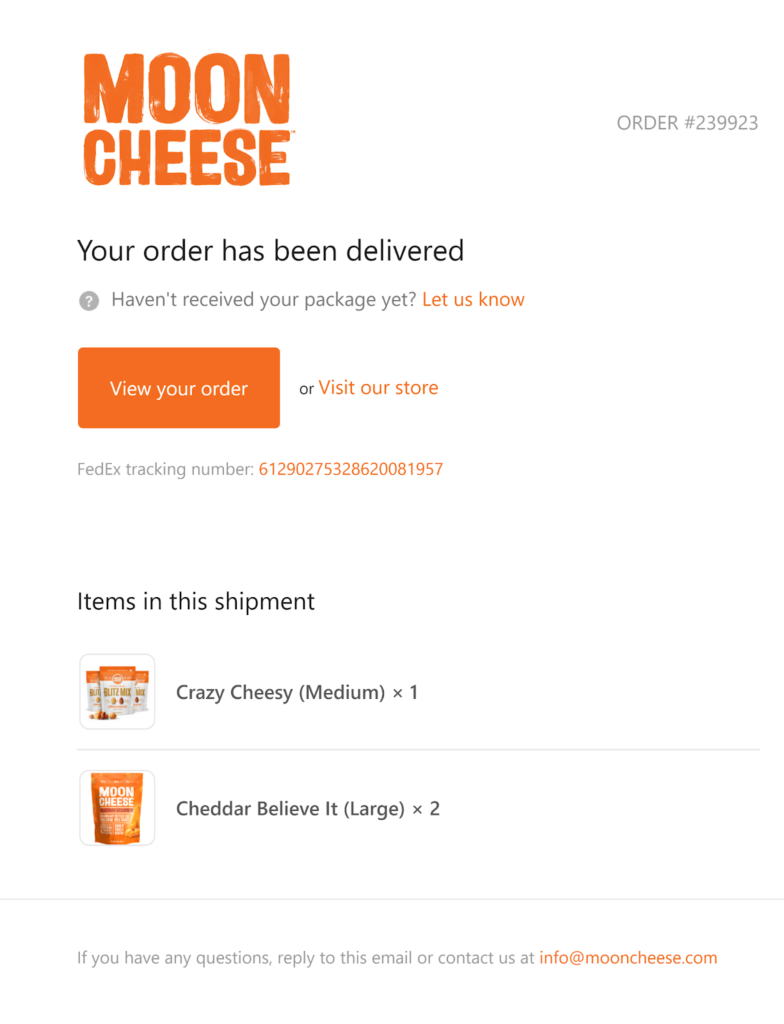
📧 Moon Cheese uses automated emails to update purchases of its low-carb, cheesy snacks when their shipments have been delivered.
Add replenishment and product recommendation emails for your subscribers who have opted-in to receive marketing messages from your brand.
Another way to up your service score using transactional emails is to warn customers about delays or pending charges. I don’t know any customer who appreciates having their subscription to a product or service automatically renewed without notice.
A simple email can win your brand a lot of goodwill.
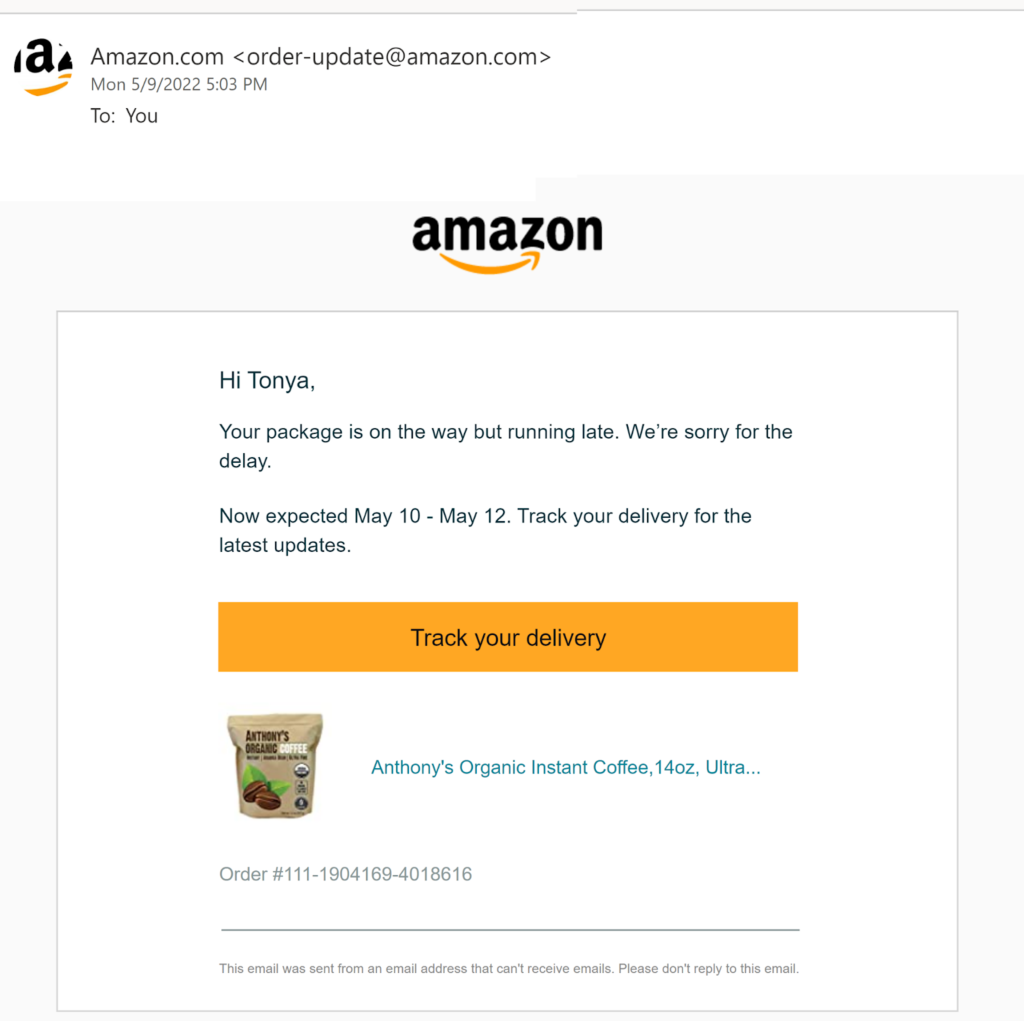
📧 Online retail giant Amazon avoids angst by proactively alerting customers to delivery delays.
📧 Zevia gives customers time to adjust their soda pop subscription orders before the brand packs and ships them.
Customize your customer interactions
The best customer experiences are customized to the needs of each individual.
Zero party data paired with automation empowers you to deliver this type of experience at scale. Use unique identifiers to recognize your repeat customers and website visitors and welcome them with personal attention and customized recommendations.
Continue this level of service by sending highly relevant, tailored email messages to your customers-subscribers. Segment your email subscriber lists to distinguish your customers by their buyer persona and stage in their customer lifecycle. Then, build email templates that incorporate dynamic content to deliver a one-of-a-kind email to each of your subscribers.
Your customized attention can go beyond using your subscribers’ names and tailoring their product recommendations. Use the behavioral and other data you gain about your customers to choose the best time to send their messages and tailor the offers you deliver to their inboxes.
Target customers with the best product/market fit
Not every customer is right for every product. If your product doesn’t check off all the boxes for someone, they’ll keep looking for one that does.
Of course, you can still generate sales and revenue by being someone’s second choice. But it will cost you less time and effort if your acquisition funnel enables buyers to self-qualify and weeds out those for whom your solution isn’t a good fit.
Avoid disappointment and defections by not overselling and under-delivering.
Use your CRM, sales data, and information from your email marketing platform to narrow down your ideal customer profile.
Which customers and email subscribers are most engaged with your brand?
Measuring click-through and conversion rates can help you identify who’s buying and who isn’t, and you can pull common characteristics about this group from your audience segmentation data.
Ensure successful acceptance and adoption of your product or service
Buyer’s remorse is a revenue-eating fungus. After-purchase doubts increase customer attrition rates and can trigger returns and refund requests. Pushback against buyer’s remorse with a customer success program that covers all the angles.
Get sticky with it!
Build in-app, onsite self-service, and live customer support processes that guide customers toward the answers they need to use your product successfully.
Then, take things a step further with proactive tactics that encourage adoption and continued use of your product or service.
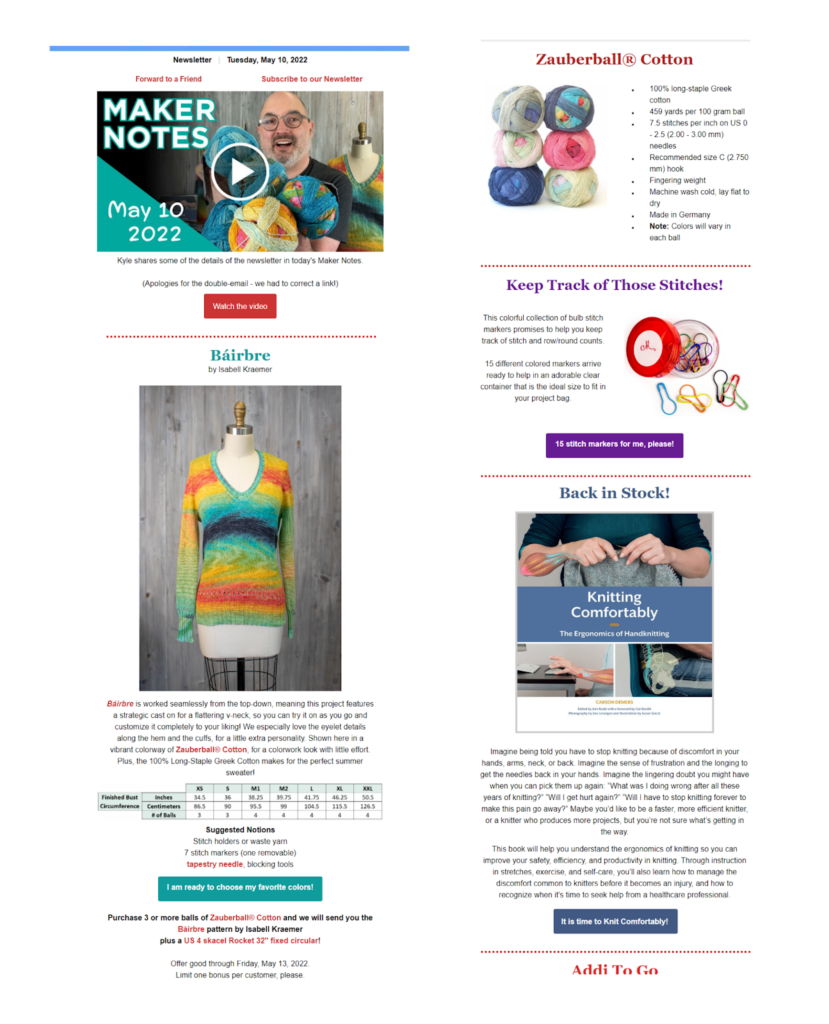
📧 Support success and encourage customers to use and consume more of your products with informational email newsletters like this one from yarn and crafting etailer, Makers’ Mercantile.
Also, make sure new customers who subscribe to your email marketing list get a welcome message that says thank you and includes links to important resources to help them experience success.
Look at your customers’ onboarding and adoption experience from their perspective If your product is hard to unwrap, requires assembly, comes with unclear instructions, or otherwise makes life harder instead of easier for your customers, you will have a long row to hoe when trying to keep them.
Be that helpful friend that always seems to make things easier.
Pay attention to the help center questions and support tickets customers submit and use these to develop content that preemptively solves their problems.
Be trustworthy and authentic
Earning customer loyalty from today’s consumers takes more than just a good deal. A 2022 report found that 84% of global consumers are more likely to stay loyal to brands that share their values.
To retain customers and grow, you need to prove to your audience that they can trust you.
Show that you care for and respect your customers by communicating with them honestly and on their terms. Respect their time and deliver value with every communication. Send messages that are true to your brand’s tone of voice, and make sure your actions match the values you promote.
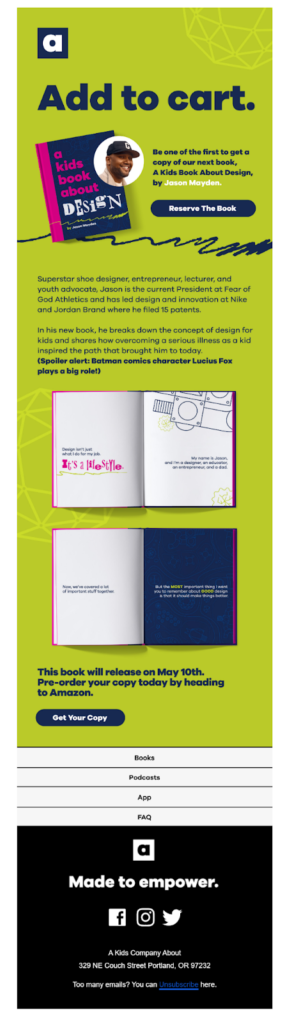
📧 Publisher A Kids Company About consistently promotes its message of diversity and each of its messages.
Avoid the temptation to use shortcuts to get opens and clicks for your emails or paid ads. A subject line or header that promises content (or bargains) you ultimately don’t deliver will harm your brand’s reputation.
Follow the best practices in The Complete Guide for Fantastic Email Subject Lines to win your customers’ attention the right way.
Give the people what they want (but only if it’s what they need)
Put yourself in your customers’ shoes when developing features and upgrades.
Is raspberry still the “it” flavor, or is it time to try something new?
Wait!
How many customers will you lose if you discontinue your classic raspberry flavor? Maybe you should do some surveys to find out.
Don’t just give them what they say they want, though. Also, develop products or features that will make your customers’ lives better using what you’ve learned about them.
Maybe if they’d ever tasted mangosteen, they’d love it. 🤷
Invite feedback about existing products and new product ideas and features from your VIP customers. You’ll gain insights from your most invested users and show them you care about their options. You can easily gather feedback by creating automated email campaigns that target your top customers.
Protect your turf with a unique selling proposition
Offer a product or service plus customer experience competitors can’t replicate. A strong USP, such as excellent customer success processes or an amazing product feature, can fend off competitors relying on price or other less compelling attractions.
Still, you can’t rest on your laurels.
Remain vigilant and continue to innovate and improve.
Keep your customers informed about your brand and its advantages over competitors by sharing product updates and feature highlights in your email newsletters.
Leverage the power of social proof by including your customers’ feedback, testimonials, and content (user-generated content or UGC) on your website, social media accounts, and in your email communications.
Listen to their feedback to discover ways to expand your moat.
📧 This message from Brass Roots incorporates several panels of customers using the brand’s products into a GIF to communicate the diversity of the brand’s products and fans.
Incorporate positive switching costs into your product or service
Positive switching costs are the opposite of negative tactics like transfer fees, complex paperwork, or incompatible parts that force a consumer to stick with your brand.
Negative switching costs may help you hang onto customers through apathy or inertia. But positive switching costs make your customers feel good about staying put.
Positive switching costs include benefits and incentives, such as loyalty programs, that make it hard to walk away.
Over 80% of consumers say they are more likely to stay with a brand that has a loyalty program. Use your marketing communications channels to inform customers about your loyalty and other programs and keep those benefits top of mind with regular updates.
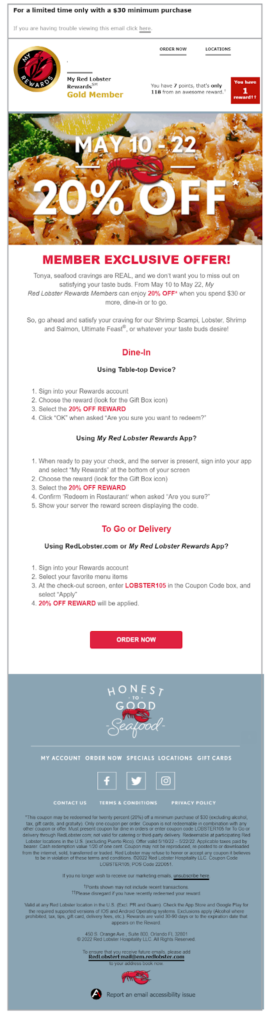
📧 Red Lobster uses a points-based program with rewards and exclusive deals to give its loyal customers a reason to return.
Delivering good customer service creates positive switching costs, too. If your product or service meets your customers’ needs and they enjoy doing business with your brand, why risk switching?
The benefits of no hassles can outweigh the benefits of a lower price.
Other positives you can add to the stack are participation in charitable causes your customers support, offering delivery or payment options your competitors don’t, providing your customers with personalized recommendations that make shopping easier, or building a community among your customers that they’d miss if they switched.
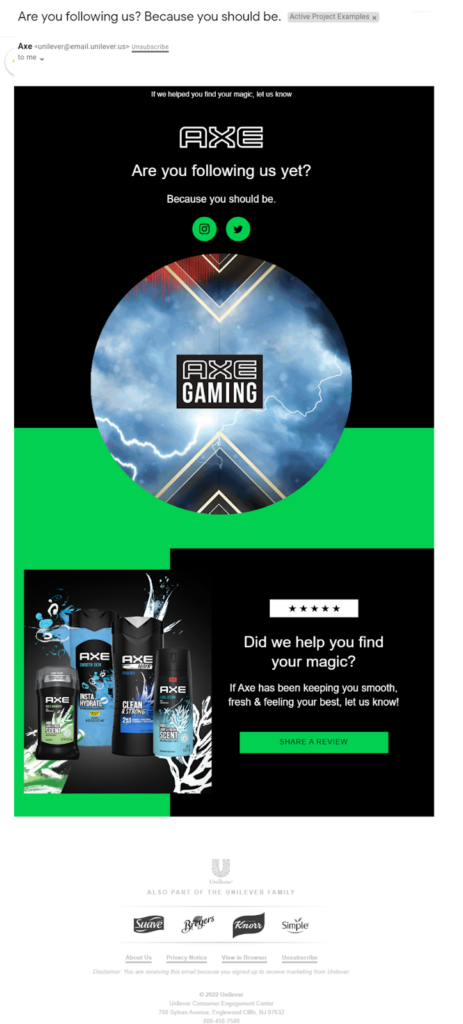
📧 Men’s personal care product brand, Axe, amps up the feeling of connection with this welcome email that invites new email subscribers to follow the brand on social media and share their feedback about the brand’s products.
Implement email marketing campaigns to reactive and win back at risk and lapsed customers
When it comes to prevention and recovery, brands have an advantage over orchardists. You can’t revive a dead tree. If the grower fails to recognize and mitigate the signs of decline in time, their investment is lost. You, on the other hand, can sometimes recover a lost customer or a customer relationship that is only mostly dead.
Re-Engagement campaigns are a common tactic email marketers use to revive subscribers whose attention has faded. You can use similar campaigns to reach your nearly-lost customers, too. Use data about where your customers are in their journey and when they last made contact with your brand to choose which messages to use.
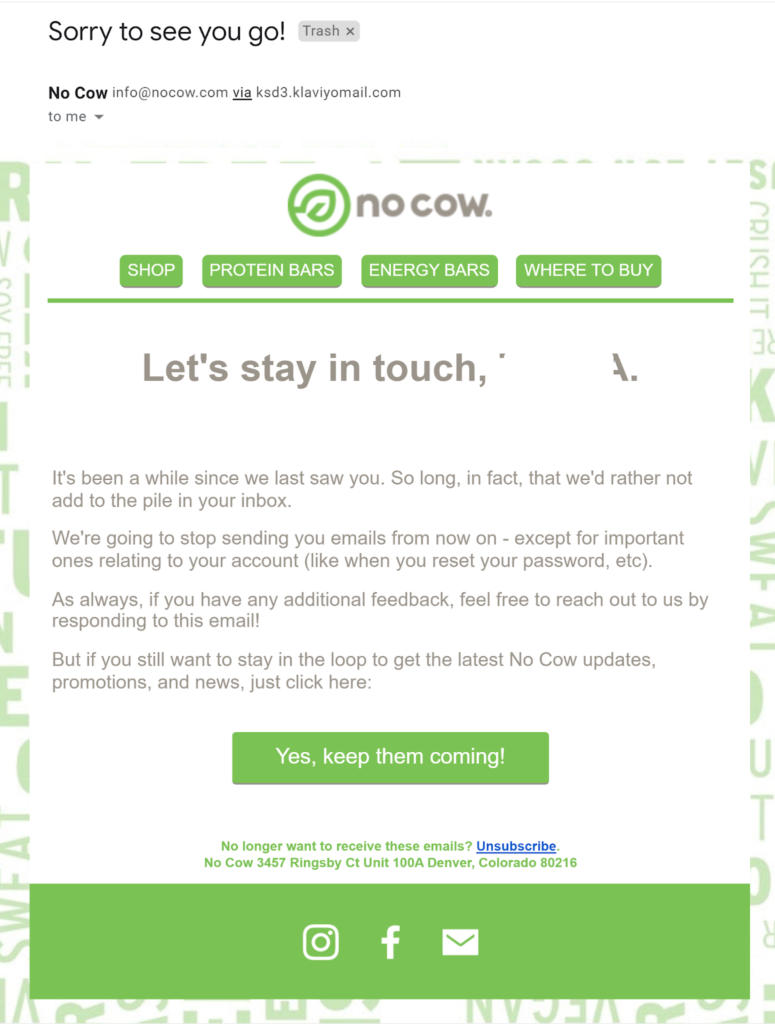
📧 Before signing off for good, vegan snack bar maker, no cow, touches base with subscribers with a win-back email that explains the next steps, noting that customers will still receive transactional messages.
If a customer has visited your website several times but has not made a purchase, an abandoned browse drip campaign that reminds them of what they’re missing and offers alternate recommendations can draw them back to you.
Use retargeting email campaigns to send educational and promotional messaging to your browse or cart abandoners at the right moment to regain their attention.
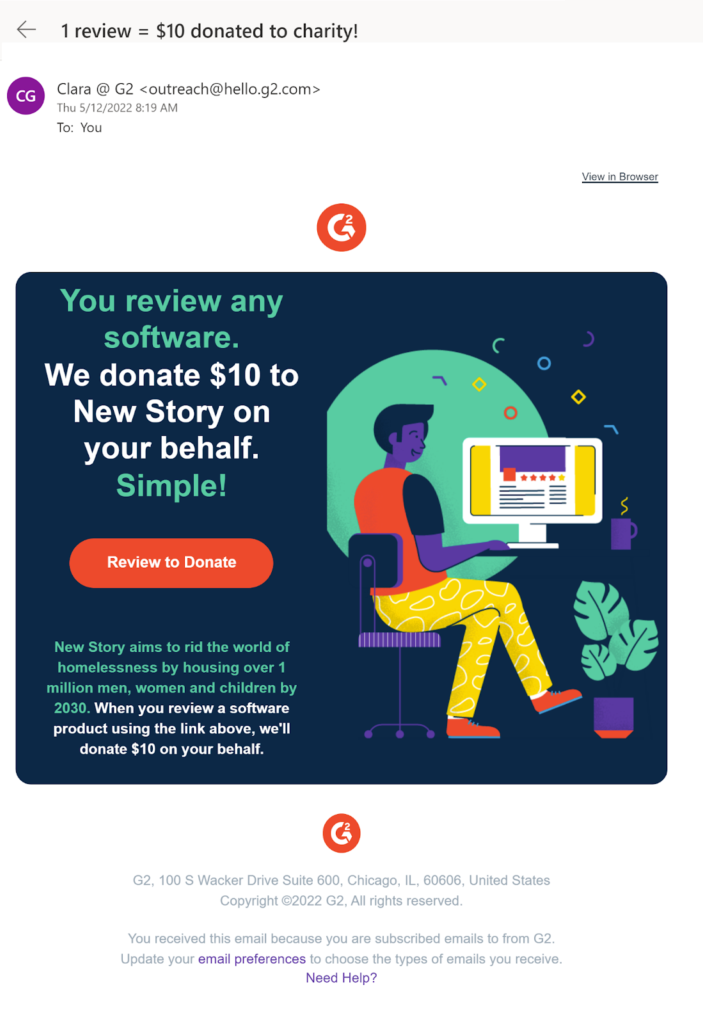
📧 G2 uses an indirect incentive to win back lapsed users, offering to make a charitable donation if they add new content to the review site.
Think about lifetime value when deciding to offer a discount or other revenue-reducing incentive. Is retaining the customer worth the cost? You can maximize your ROI by trying low-cost methods of persuasion such as social proof, exclusivity or urgency first.
What about customers who’ve been completely off the grid for a while?
Well, first, make sure their email address is still valid and clean–don’t get caught in a spam trap!
Check out our guide to list hygiene for step-by-step instructions on keeping your email lists accurate and up-to-date.
Then, use a re-engagement strategy similar to your email subscription reactivation campaigns.
Send a single message, or even better, a series of messages, that gauges the customer’s continued interest and offers support to help them achieve their objectives.
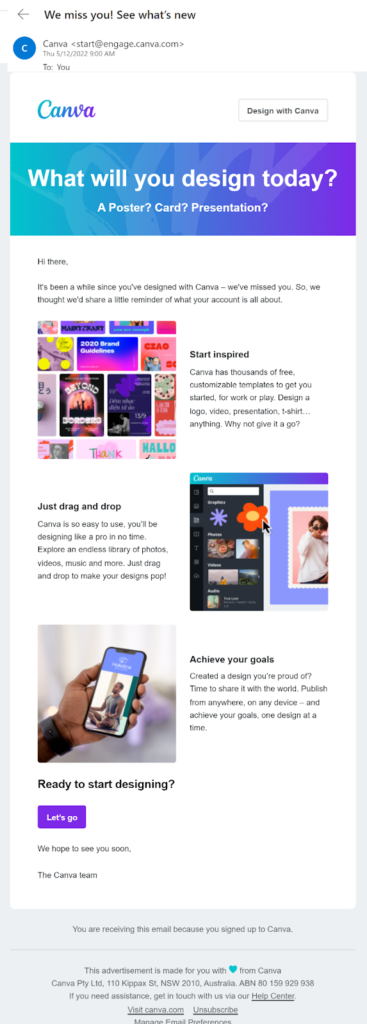
📧 This email from design app Canva seeks to reignite users’ creative spark by highlighting the app’s features.
Set up automated drip campaigns triggered by early warning signs of churn to manage attrition without losing sleep. Your automated campaigns and the resulting metrics will help you lower attrition rates and learn more about your customers.
Nurture your customer relationships to keep your business growing
Across channels, and throughout your customer’s lifecycle, the key to reducing attrition and earning loyalty is attention. Pay attention to what your customers want and what their direct and indirect behaviors are telling you about your performance.
Give your customers personalized attention that smooths each step on their journey and makes it easy to say yes to your brand.
Explore more tips to deliver personalized attention, smooth your customer’s journey and reduce churn in these articles from your friends at Ongage.


 Academy