

Today’s buyers travel along diverse and complex paths to reach the end of their journey and become your customers. Which routes get them there the fastest? What campaigns capture conversions? Multi-touch marketing attribution delivers the clues you need to unravel the mysteries of your customers’ behaviors. Intrigued? Come along and discover why multi-touch attribution should be in your marketing analytics stack.
It’s the marketer’s conundrum.
You know marketing contributes to your organization’s growth, adding customers and revenue, but how do you prove it?
How do you “show them the money” and make the case for your brand to invest in marketing?
More importantly, how do you know when and where to spend your marketing budget to generate the best performance? What motivates your customers to take the next step on their customer journey?
Sure, you have your email analytics, but buyer’s journeys are becoming more complex and fragmented while marketers’ access to data is becoming more restricted. So relying on that alone is not enough.
You need a keen mind, careful attention to detail, and data analytics that examine every touchpoint to unlock the secrets behind your performance.
Multi-touch attribution is one method that can lead you to answers.
What is this analytics model, and how does it work?
Grab your cap and notebook, and let’s investigate how you can use multi-touch attribution to gain new customers, increase sales and expand revenue.

What is Multi-touch attribution and why do marketers use it?

Multi-touch attribution (MTA) is a type of customer journey analytics designed to identify as many of these touchpoints as possible and measure their impact on your brand’s sales and revenue.
Along with other measures of marketing effectiveness, including sentiment analysis, channel performance metrics like your email marketing program’s analytics, acquisition cost, and revenue calculations, multi-touch attribution provides you with the bigger picture.
It gives you the clues you need to develop a stronger, more profitable customer acquisition pipeline and deliver the personalized customer experiences today’s buyers expect.

Multi-touch attribution vs. marketing mix modeling
Attribution is often used in parallel with other measurements including media or marketing mix modeling (MMM), which examines product distribution, pricing, promotions, and other elements of your marketing mix.
It does so along with external factors because neither set of insights alone can develop a complete picture of your strengths and weaknesses.
Where marketing mix analysis gives you a zoomed-out view of your marketing’s effectiveness, multi-touch attribution analysis answers the questions: What made this customer decide to purchase, and how can I replicate that success?

Why MTA? How do businesses use the data gained from multi-touch attribution analysis?
Multi-touch attribution contributes to marketers’ knowledge with information that is both broad and granular.
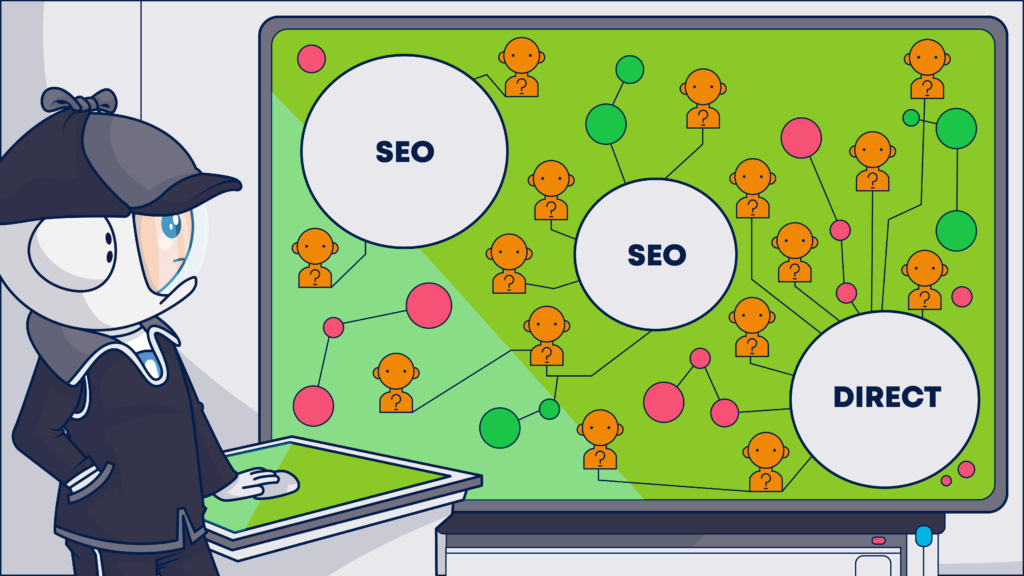
Doing the seemingly impossible, multi-touch attribution combines data points about a single customer across channels, devices, and campaigns to identify the significant touchpoints along that customer’s path to conversion.
This is no small feat of detective work!
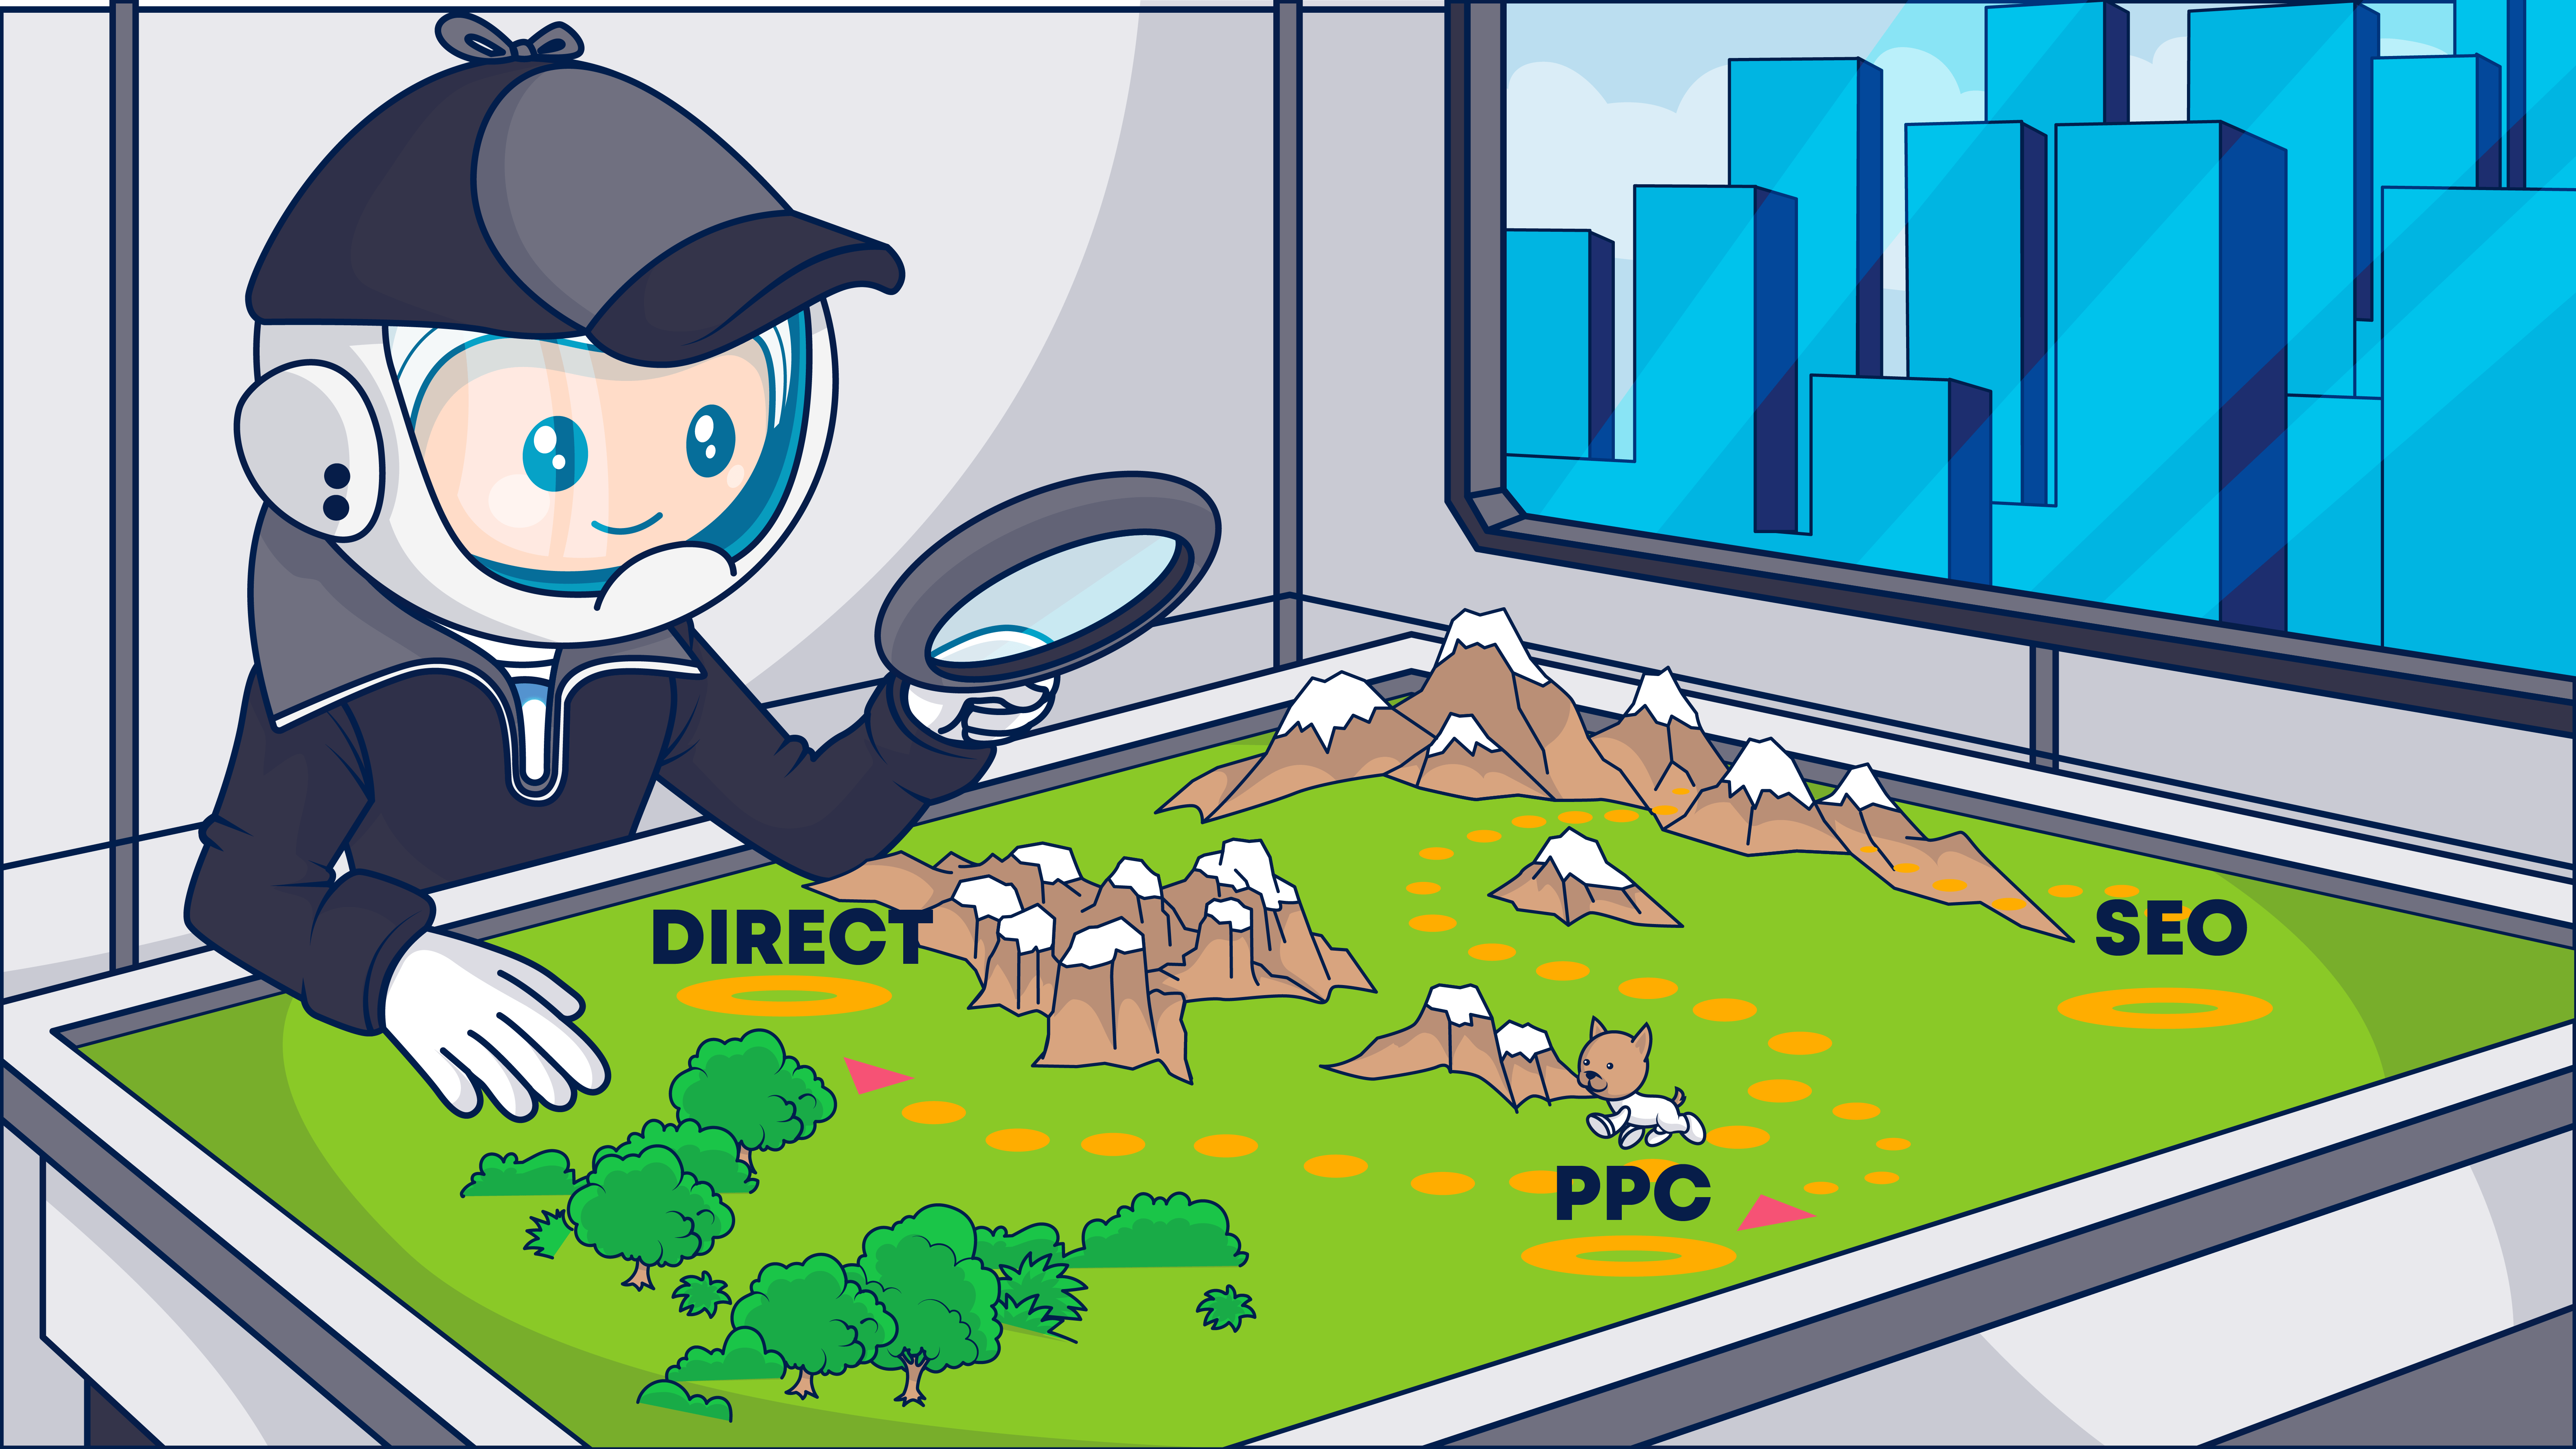
The multi-touch attribution model is like the Sherlock Holmes of marketing effectiveness metrics.
Like that clever and meticulous investigator, multi-touch attribution doesn’t settle on the obvious or easy answer.
Instead, its assessments require in-depth investigations to gather clues, retrace steps and connect the dots between a customer’s interactions with the brand and their decision to purchase.
Brands use multi-touch attribution to
- Optimize marketing spend.
- Fine-tune customer acquisition funnels.
- Shorten sales cycles.
- Enhance audience segmentation and message targeting.
- Increase marketing ROI.
- Lower customer acquisition costs.
- Improve the effectiveness of marketing collateral.
- Reduce the influence of emotion and bias in their decision-making processes.
What types of questions can multi-touch marketing attribution answer?
Multi-touch attribution tools vary in their scope and the degree of detail they offer.
The most sophisticated stand-alone multi-touch attribution solutions enable you to collect and analyze contextual and behavioral data from multiple sources to generate reports that reveal:
- Which customer acquisition tactics work and for which types of customers.
- The specific campaigns and messages that resonate with buyers.
- Where customers are encountering your brand.
- Which channels appeal to different audience segments at each stage in your funnel.
- How customers are engaging with your brand.
- Where along the buyer’s journey prospects drop out of your funnel.
- Which campaigns or channels deliver the highest conversion rates.
- Which marketing tactics generate the most leads?
- How many leads and conversions did a specific campaign, keyword, or piece of marketing collateral generate?
The reports generated from multi-touch attribution analytics can also reveal clues about the average length of your sales cycles, each of the potential touchpoints of your buyer’s journeys, where micro-conversions take place, and when obstacles to conversion arise.
Is multi-touch attribution dead? Long live multi-touch attribution
Despite its many uses, maybe you’re wondering if your analytics toolkit should include MTA. Or does the model’s complexity and data deprecation’s rise make MTA a relic of the past?
The story isn’t over yet for MTA. In fact, adoption rates are increasing.
According to The State of MTA: Unbiased Research from the MMA, 40% of North American MMA member companies surveyed in 2021 said they were already using a multi-touch attribution solution. Another 41% said they planned to adopt the technology within the next 18 months. That a doubling of adoption rates by 2023.
Emarketer reports that among US companies with at least 100 employees, 65% used multi-channel attribution models in 2021. An increase in the accessibility and sophistication of multi-touch attribution platforms has made these growing adoption levels possible.
The shift by organizations to online and hybrid sales and marketing funnels and the rapid pace at which buyer behaviors changed over the past several years have made access to actionable data critical.
Further, advances in data integration and AI have made multi-attribution models more accurate and accessible, alleviating many of the issues earlier adopters experienced.
As omnichannel marketing methods that incorporate online and offline components gain in popularity, multi-touch attribution is the marketer’s path to understanding.
How does marketing attribution work?
Marketing attribution is the method marketers use to analyze the details of individual customers’ conversion paths to identify key inflection points and points of friction by assigning or “attributing” credit for a conversion to a specific event, tactic, or channel.
Most paid ad platforms provide advertisers with a means of attributing performance as part of their service package.
Ongage’s Conversion Points feature, for example, enables our clients to track post-click conversions beginning with a link in an email message through the completion of the subsequent conversion action. The resulting data can be aggregated and used to build custom reports.
Similarly, Google Analytics enables you to create single- or multi-touch and channel attribution models to keep track of the paths customers take to reach your website.
Attribution frameworks may track only specific channels and devices or follow a customer’s entire journey across analog and digital waypoints.
Channel attribution draws a link between the channel through which a customer learned of your brand and was converted. Touch-based attribution looks at the distinct exposures and interactions the customer has with your brand.
Each engagement or non-engagement with your automated email campaigns is a touchpoint that a multi-touch attribution model can record and evaluate.
Modern attribution isn’t always just about marketing, either.
On the sales side of things, journey orchestration and revenue intelligence platforms use attribution tracking to manage and improve funnel performance (and assign commissions).
When a member of the sales department collects emails or names at an in-person conference and adds them to your sales CRM–they’ve recorded a touchpoint that you can factor into your attribution model.
Organizations that share customer data across departments may include customer success and support calls in their attribution data set. A successfully resolved support call may be a critical touchpoint in a repeat sales or upsell funnel. Understanding how every interaction with your organization impacts customer loyalty and lifetime value is one secret to sustainable growth.
Pulling all your data from multiple sources together, normalizing the data to remove redundancies and inaccuracies, and analyzing the set as a whole renders what is called “closed-loop attribution.” Instead of looking at one or two segments of your customer’s journey, you’re following it from end to end.
Attribution models are the formulas or rule sets we use to define the data to be collected and what happens to it. For marketing attribution, these models define the actions and conversion events to be analyzed and the credit or value to be assigned to each.
Simple attribution models may answer questions such as, “What percentage of buyers who clicked through this ad made a purchase?” More complex models may answer more in-depth questions about the buyer’s journey itself, such as, “How many touchpoints occur between awareness and conversion?”
Models’ rules help us process data systematically, reducing bias and error as we look for patterns or attempt to make predictions.
Because not every business model has the same customer journey or needs the same data about how their customers convert, many attribution models exist. Each attribution model uses a distinct set of rules to select the causes to which effects will be attributed.
Attribution models weigh data and assign credits to calculate results
Analytics models use weighted systems to formalize how different factors are valued. Weighing may compensate for an imbalance between different factors to ensure equal representation or to advance a factor that is more important, intentionally creating an imbalance.
Positive or negative multipliers even out or favor different factors in a chosen framework.
If you’re a sports fan, you are probably very familiar with weighing and the effects it has on the fates of individual athletes and teams.
Weighted scoring also helps manufacturers compare the costs and net gains from different products or production processes, pollsters boost the volume for underrepresented voices and product managers prioritize tasks.
Attribution models vary in the way credit is distributed.
Some models assign all credit for an associated event to one cause. Other attribution models distribute the credit equally or disproportionately between several causes. Weights are often assigned based on a factor’s proximity to a particular stage in the buyer’s journey. For example, a higher value may be assigned to the channel, touchpoint, or other factors that initiated the journey or to those factors that are closest to the conversion event.
Proximity to the start or end of the journey isn’t the only relevant consideration when choosing which factors to favor.
Some attribution models boost factors that are linked to high-value conversions or customers having greater lifetime values. This type of analysis supports relationship marketing strategies that maximize each customer’s value to the business.
Using this type of value-based weighing can reveal which channels or specific marketing campaigns most effectively attract your ideal customer (and which ones are attracting customers that produce low or no ROI).
Where does the data that feeds attribution models come from?
Quality data is the fuel that feeds the modern analytics machine. Where do you get it, and how do you ensure it’s accurate and actionable?
Just as even the most careful investigation can’t retrace every step leading up to the commission of a crime, no attribution model can account for every single factor that influences a customer’s decision.
There are simply too many touchpoints that aren’t traceable.
In particular, tracking data for touchpoint attribution requires a unique identifier that links the individual customer to each step they take.
Consumers’ privacy expectations, privacy laws and regulations, and the deprecation of third-party cookies and other sources of customer journey information can make collecting attribution information difficult.
But as marketers and advertising partners prepare for the next phase of marketing attribution, you can expect new methods of identity resolution to be part of the process.
To expand your knowledge about your customers’ journeys, start with your existing data sources like Google Analytics, individual advertising partners and platforms, and your CRM.
Each of these tools uses a mix of different tracking technology to connect individual touchpoints to a specific customer and a specific conversion event.
Data collection methods to consider are:
- Including unique UTM codes in the links that you insert in your emails or other messages.
- Using code-based pixels or floodlight tags to follow a user’s flow across your website.
- Attaching first-party cookies to your webpage. (You can still use third-party cookies for now. But it’s best to not get used to having these around!)
- Identifying visitors using indirect methods, such as their IP address. This one won’t tell you exactly who visited–but it can help you narrow down the candidates. The same is true of device IDs as an identification method.
- Developing methods to capture a unique visitor ID for each customer that you can use to gather marketing and conversion-related data about them. When you invite visitors to log in as soon as they reach your website, you can then attach their subsequent behaviors to their email address or account name.
Data integration challenges of multi-touch attribution
Traceable touchpoints from different sources aren’t always readily available or easily integrated.
While many of the platforms or channels you use to reach your customers employ attribution models and present performance reports based on the results, they aren’t impartial when it comes to the data they collect and distribute.
The information that might serve you best may not be the information your partners are interested in collecting. Plus, their attribution analysis is limited to customer interactions that occur within the platform or channel’s scope of influence–it’s a “walled garden.”
Ongage’s email marketing platform enables you to export data to your CRM or other data storage platform and import data from your CRM and back.
Services such as GoSquared or Google Analytics consolidate some attribution data and may allow you to create reports using either single- or multi-touch models. But these services aren’t all-inclusive.
Further, each organization uses different methods for identifying conversion events, factors that influence those conversions (touches), and the links between them.
One significant example of this lack of uniformity is in the look-back or attribution windows used by different vendors and platforms. The default attribution window for most marketing channels is similarly brief, which limits the insights their data can provide.
📅 Google Ads’ maximum conversion window is 90 days. If a buyer viewed an ad outside that window it won’t be recorded as a conversion-impacting touchpoint.
📅 Facebook’s Ads attribution system measures ad actions using 7-day or 1-day windows for click-through attribution and one day for impressions. Mobile marketing and attribution platform.
📅 AppsFlyer’s attribution window maxes out at 7 days for data that can be connected to a specific user and 24 hours for probabilistic identifications and view-through attributions.
The attribution window that is best for your brand will be the one that aligns with the length of your sales cycle–which may last days, months, or even years.
When your buyer’s journey is long or complex, the limited information available from individual vendors may not be actionable, or worse, lead you astray.
Modern multi-touch attribution platforms alleviate the risk of incomplete or biased data, bringing together information from across your organization and beyond to create an accurate view of your customers and their journeys.
Companies such as Nielsen, Heap, LeadRx, and LiveRamp are bringing together data from paid and organic channels, including connected TV (CTV). Snowflake and other customer data platforms are stepping up to fill in marketers’ knowledge gaps, too.
Types of attribution models: Multi-touch attribution versus multi-channel, multi-platform, and multi-click attribution

Multi-touch attribution can cross channels, devices, or platforms, but it doesn’t always.
Nonetheless, you’ll find that many professionals and multi-touch attribution solutions providers use the terms “multi-touch,” “multi-channel,” “cross-channel,” and even “multi-click” interchangeably to describe multi-touch attribution.
These labels aren’t inaccurate (all the time), but they also don’t tell the full story.
A complete multi-touch attribution system designed to propel your brand forward and inform better, more efficient customer journeys incorporates every recognizable and recordable touch along that journey.
Full multi-touch attribution draws from each of your data sources, including your advertising partners and CRM, to track both online and offline touchpoints to the greatest extent possible.
Yet within the multi-touch attribution ecosystem, there are a lot of solutions that haven’t reached this level of omniscience.
Only in recent years have advances in technology, paired with the rising costs of not knowing what motivates purchasers, accelerated the drive to develop powerful, integrated customer journey analytics solutions.
What’s the difference between these new, true multi-touch solutions and some of the other models that carry the multi-touch designation?
Sometimes, nothing. Frequently, people use the terms synonymously. When the user says “multi-channel attribution,” what they really mean is “multi-touch, multi-channel attribution.”
Oh, if only that were the end of it, though.
Multi-channel attribution (MCA) may also refer to actual “multi-channel only” attribution. In its truest form, MCA tracks only the channel touched–not the specific campaign or marketing collateral. You won’t gain data about the messaging or the order of the customer’s interactions when using MCA.
Multi-channel attribution will tell you a customer opened an email (the channel). Multi-touch attribution will tell you that the customer opened an email, identify the associated email campaign, and at what point in the sequence of touchpoints along their path the open occurred.
This data offers granular insights into the individual actions behind an email’s click to open rates.
An MCA might record that the customer clicked on a paid social media ad before visiting your website. The MTA process would also identify which ad they clicked.
Multi-or cross-platform attribution models work similarly, except they distinguish between app or web-based conversion events. And, as you can probably guess, multi-device attribution bridges devices to bring together customer intel.
What about multi-click attribution?
What makes multi-click attribution is… the click. When using a true click-based model, only click-throughs are recorded as touches or credited for any ensuing conversion. This leaves impressions and non-digital events out in the cold.
The term multi-click attribution is often used to mean multi-touch when the underlying model tracks digital touchpoints only. But real click-attribution’s scope is even narrower and excludes other digital data, too.
For instance, a customer may have scrolled past three ads on social media that raised their awareness before entering your company’s name in a branded search, but it’s the click-through from the search results that will be attributed with the conversion. (You can imagine how your social media marketing team feels about that!)
Another term, impression or “view-through” attribution, describes non-click digital exposures to your brand, such as ads that appeared in a customer’s social media feed. Impressions can be difficult to credit fairly because of variances in the way platforms count impressions.
I think we all know that just because an image zipped past us in our social media feed doesn’t mean our minds actually noticed it. Or… maybe we did. 🤔
If you include impressions in your attribution data set, you’ll at least have the chance to consider how these potential views affect conversion rates.
Touchpoint-based marketing attribution models
Touchpoints are the interactions with or exposures to your brand that an individual experiences. Organizations create customer or buyer journey maps to identify all the potential touchpoints along the path to purchase. Then use attribution models to evaluate the relative impact of these various points.
Touchpoint-based attribution models are among the most in-depth marketing attribution models because they look at conversion data at the individual customer level to draw conclusions about cause and effect.
These models examine the events along a specific customer’s journey–what happened before they converted?
Every trackable touchpoint for every customer is recorded and assessed. Attribution credits are then distributed based on the model rules.
What touchpoints do touchpoint-based attribution models analyze?
All the touchpoints someone encounters will contribute to their perception of your brand. Yet not all touchpoints on a buyer’s journey are marketing-related.
Your organization’s marketing, sales, PR, and other teams create some of those touchpoints, such as paid ads and email campaigns, as part of your customer acquisition funnel and hope that they elicit the desired response.
Other touchpoints are partially or entirely outside your control.
These unknown or uncontrolled points of contact may include organic social media mentions and personal recommendations.
How do you keep track of all these interactions and exposures?
Different touchpoint-based attribution models serve businesses with varying journey lengths and intervals. In a time of “abundant choice and limitless information,” uncovering the key trigger points that prompt action requires deeper investigation.
Attributing a successful conversion to one or more events is sometimes easy–the evidence is right before your eyes and the motive is clear.
But open and shut cases are becoming increasingly rare as customer journeys become multi-channel, multi-platform, non-linear and diverse.
Often, it is not a single touchpoint but the right combination of touchpoints across channels such as SMS and email that wins the conversion.
Further, if a company’s buyer’s journeys span months or even years, involve multiple stakeholders, micro-conversions, and channels, then a basic attribution model won’t yield much useful intel.
To illustrate, I made the chart below representing the touchpoints along several customer’s journeys.
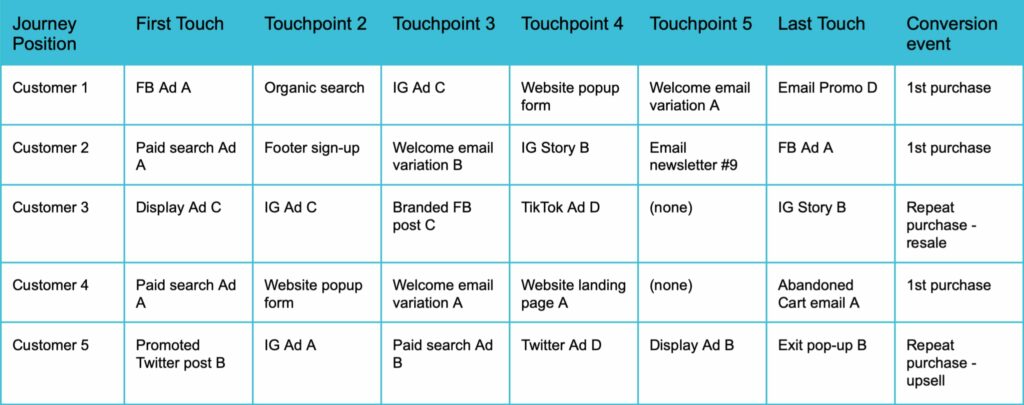
In this hypothetical, each customer encountered a different mix of marketing collateral across different channels, and none of their journeys followed the same sequence.
Some customers joined the brand’s email list (a micro-conversion) before making a purchase, while others did not. Not all the customers required the same number of touchpoints before conversion, either.
Attribution systems analyzing hundreds of thousands of customer journeys may record and process millions of touchpoints.
What happens to that data is up next.
Single vs. multi-touchpoint attribution models

Touchpoint-based attribution models may be single- or multi-touch, and within each category, different models prescribe how credits are assigned.
How you assign credit for the touchpoints you identify in touchpoint-based attribution determines whether your model is single- or multi-touch.
Both multi- and single-touch attribution models investigate causal connections at the customer level, often crossing channels, platforms, and devices to do so.
📌 When you track your customer-level engagements using your email marketing platform, you’re using single-channel, touchpoint-based analytics.
📌 When you connect that data with other analytics tools, your CRM or data warehouse, your single-channel touchpoint analysis becomes multi-channel.
How do the two types of touchpoint attribution systems compare?
Single-touch attribution models’ strength is in their simplicity.
They operate using a small rule set and answer a single question. These attribution models offer valuable insights into the effectiveness of your top-of-funnel or end-of-funnel activities.
But, if you’re excluding data about the trackable touchpoints that take customers from start to finish, you are missing out on valuable intel about your marketing funnel’s health and your customers’ conversion paths.
Multi-touch attribution overcomes the limitations of single-touch attribution by extending the search for contributing factors beyond a single touchpoint.
MTA models are typically more complex than non-touchpoint or single-touchpoint models.
Within the multi-touch attribution category, various models introduce greater or lesser levels of complexity to your investigations.
Types of single-touch attribution models
As you may have deduced, single-touch attribution assigns credit for a customer’s conversion to a single touchpoint.
Regardless of how many interactions the customer has with your brand prior to conversion, a single-touch attribution model assigns 100% of the credit to that one contact.
Common single-touch attribution models include:
⚖ First-touch attribution which awards all credit for a purchaser’s conversion to their first recordable contact with the brand.
⚖ First-click attribution. This model credits the first click for the subsequent conversion. Offline conversations, ad impressions, and other non-click-through events don’t get scored.
⚖ Last-touch attribution models, which assign weight only to the final contact prior to conversion.
⚖ Last-click attribution models. These models assign full credit for the conversion to the last click-through prior to the deal’s closure.
⚖ Last non-direct click model credits the final touchpoint prior to conversion but excludes direct traffic where the customer has arrived at your site after typing your URL into their browser.
If we applied first-touch attribution to the chart I created, Paid Search Ad A would rank first in credit for conversions, with FB Ad A, Display Ad C, and Promoted Twitter post B tied for second place.
A last-touch attribution model would rank the five tactics that landed in the last-touch position equally, with no one method pulling ahead.
Only FB Ad A surfaces in both first- and last- touch models, demonstrating how wide the disparities may be when assessing top, middle and bottom-of-funnel tactics.
Types of Multi-touch Attribution Models
Early MTA models were limited by available technology, with some offering little more than a mashup of one or more single-touch models.
Thankfully, just as nature abhors a void, so does Martech. As new channels, paths, and marketing tactics evolved, multi-touch attribution models did too.
Multi-touch attribution examines multiple touchpoints and assigns some or all of them fractional credit based on the model’s credit distribution rules. This is why you may see multi-touch attribution referred to as “fractional attribution.”
What are some of the multi-touch attribution models you can use to learn about your customers and your conversion performance?
Check out the following list of multi-touch attribution models from basic to advanced.
⚖ The linear multi-touch attribution model
This is the participation-trophy version of multi-attribution modeling. Credit is distributed equally across each point in the customer’s journey.
A touchpoint only needs to appear in the journey to earn recognition, and regardless of its position in a conversion timeline, its score remains the same.
Why use this model? Sometimes showing up is all that matters.
A linear multi-touch attribution model provides insights into which of your marketing tactics reach your customers.
If some of your paid ads score significantly higher for attendance than others, these metrics can prompt you to investigate how your targeting and ad timing affect what your audience sees.
Are they seeing the same ad or other assets repeatedly? Are some of your ads not finding their audience? Or are you missing opportunities because a large percentage of your marketing assets aren’t prompting conversions?
⚖ The time-decay attribution model
This model also assigns credit to every touchpoint, but grades them based on their proximity to the conversion event. This model raises the profile of bottom-of-funnel activities at the expense of top-of-funnel interactions.
A time-delay model may enable you to use a wider attribution window–for instance, looking back for 90 days instead of 30–while still weighing those actions that are closer to conversion more heavily than older events that may or may not be related.
How do linear and time-decay results compare? Let’s take another look at that chart. 🙂
In a straight linear model, Paid search Ad A would rank higher as a conversion influencer than Email Promo D or Exit pop-up B, because the paid search ad impacted two customers’ journeys.
In a time-decay model, Email Promo D or Exit pop-up B would each receive more credit than the paid search ad because of these factors’ proximity to the conversion event.
⚖ The U-shaped or position-based attribution model
Rescuing you from having to choose between first and last touches, this model gives both an equal share of the credit.
For each consumer path recorded, the touchpoint that initiated the customer’s journey receives 40% of the credit, while the last touch before a conversion gets 40% as well.

Typically, the remaining touchpoints aren’t completely ignored in this model, but must take their share of credit from the remaining 20%.
Some U-shaped models distribute all credit between the two points and other customer connections receive no credit.
⚖ J- and Inverse J-shaped models
These models are similar to the U-shaped model that distributes credits disproportionately between the first and last touch but with a scale tipping twist.
In the J-shaped model, the first touch receives 20% of the credit, while the last touch receives 60%, with the remaining 20% distributed amongst the other touchpoints.
The effect of the J-shaped attribution model is similar to, but more extreme than, the time-decay model.

The Inverse J flips in favor of the first touchpoint, giving it 60% of the credit. It’s like a first-touch model with a tail.

⚖ The W-shaped model
This multi-touch attribution model values first and last touchpoints highly but also gives credit to the touchpoint most closely linked to the customer’s transition to the middle of the funnel.
The exposure or interaction that made the customer aware of your brand receives 30% of the credit. The lead conversion or micro-conversion point receives 30% of the credit.
Another 30% of credit for the conversion is attributed to the last touchpoint, while the remaining 10% is distributed among any remaining interactions.
This center touchpoint may be the transition from a stranger to a marketing qualified lead (MQL) or another micro-conversion the marketer defines.
Why go with W?
Using this model recognizes the role of your lead magnets and other middle-of-the-funnel nurture activities in ultimately attaining conversions and helps you identify which marketing collateral is most effective at lead conversion.
⚖ The Z-shaped or full-path model
This model doesn’t force you to choose between lead generation or opportunity creation when assigning middle-of-the-funnel credit. It distributes credit equally between the four main steps of the journey, from awareness to purchase.
Conversion credits for a Z-shaped analysis are distributed as follows:
- 22.5% goes to the first touchpoint.
- 22.5% goes to the touchpoint that converted the customer to an MQL.
- 22.5% is assigned to the opportunity creation or sales qualified lead (SQL) touchpoint.
- 22.5% is credited to the touchpoint immediately preceding the sales or revenue conversion.
- 10% of the credit for the conversion is divided between any other recorded touchpoints.

What if your customer acquisition funnel doesn’t fit neatly with any of these models, or they don’t facilitate finding answers to your questions?
Then you can develop your own custom attribution model.
For example, you might choose to use a U- or W-shaped design, but assign a greater percentage to the “in between” touchpoints to learn more about your customers’ total brand experience.
⚖ A goal-driven custom attribution model
This is a customized attribution model that assigns values based on the achievement of a particular goal, such as a page view, download, list sign-up, or other events.
If you have five distinct micro-conversions in your funnel, you could use a weighted model to identify the touchpoints most likely to achieve each one. The resulting data will help you identify bottlenecks in your funnel.
⚖ Algorithmic attribution models
Also known as data-driven or dynamic attribution, algorithmic attribution uses statistical analysis of data about both converting and non-converting touchpoints to select which touchpoints should be included for consideration in your analysis and how much credit various points along a path should receive.
In other words, machine learning decides how to assign credit for you.
Algorithmic models may examine how customers interacted with various touchpoints and the relationship of those touchpoints to one another.
Does the order in which customers encounter them affect the balance of power between one or more touchpoints? The algorithm detects these types of influences and adjusts the assignments of credit based on what it discovers.
Data-driven models require access to adequate, accurate information and powerful analytics tools to be effective. Adopting a stand-alone multi-touch attribution solution to collect and coordinate all your platform and partner data into a single source of truth puts that knowledge in your hands and under your control.
Preparing to enter the exciting new world of customer journey analytics and multi-touch attribution
Despite a growing desire for privacy, your customers also want to see relevant, useful content–including ads–that helps them achieve their goals and meet their needs.
When you use attribution metrics as part of your overall marketing strategic planning and execution, you give your customers what they want.
How can you develop an MTA program that gets you the answers you need to optimize your funnel, increase revenue, and enhance your customers’ experiences?
Among the factors to consider when choosing an MTA model are your business objectives and the goals of your analytics.
If you’re looking for ways to improve your lead generation effort, then a model that focuses credit on top-of-the-funnel performance can point you to those marketing tactics that generate the most likely to convert leads.
If closing the deal is where you need shoring up, examining the post-SQL stages in your funnel can help you figure out where your weaknesses are.
The length of your sales cycles and your reliance on new versus repeat customers, as well as the amount and quality of data available to you will also affect your selection.
When developing your multi-touch attribution marketing processes, follow these best practices:
- Start by identifying the goals of your MTA program and defining your KPIs. You may want to analyze just one campaign or conversion path to learn more about the potential of MTA before fixing your final goals and objectives.
- Identify your data sources and begin the process of cleaning and normalizing that data. At the same time, make sure that any data you use or plan to use has been collected in conformance with current privacy rules and expectations.
- Map your customers’ journeys. This is something you probably already do, but do it again before you embark on this project. Since the beginning of the pandemic, customers’ paths have changed dramatically.
Also, today’s paths are non-linear and differ between audience segments. Developing journey maps that take into account both traceable and non-traceable touchpoints will give your subsequent analytics a strong foundation upon which to build.
- Choose the other measures, such as marketing mix models that you’ll use in coordination with MTA and how you’ll integrate your various data tools. Will you use a data warehouse, an analytic dashboard, or both?
- Question your assumptions. An analytics model works best when it is free from bias. Yet, building models without bias can be challenging. Don’t let your gut instincts determine which data you’ll examine and which answers to validate. Instead, let the application do its work to surface insights and build your questions from what you discover.
“There is nothing more deceptive than an obvious fact.”
― Arthur Conan Doyle, The Boscombe Valley Mystery – a Sherlock Holmes Short Story
- Test, reiterate, improve, and then scale. I’ll close this list as I opened it, with a suggestion that you start small. Test several attribution models and experiment with what your organization can gain from their reports before you implement MTA across all your marketing endeavors. That way, you can work out any technical, process, or people errors before you invest heavily in a particular solution.
As buyer’s journeys become more complex and marketing channels more fragmented, marketers need solutions to piece together the clues and solve the riddle of how to deliver the right message at the right place and time.
From sentiment analysis to details about which devices their customers are using, the quest for the data that will give them an edge never ends. Multi-touch attribution is one of the ways you can gain an inside look at what makes your customers do what they do.
With that knowledge at hand, you can craft omnichannel marketing campaigns that reach more customers and invest your marketing resources more effectively.
Speaking of reaching your customers, check out this ultimate guide to email copywriting: How to level up your email copywriting skills—a step-by-step guide. It includes everything you need to create can’t-miss email messages that engage and convert.
Combine this with a couple of attraction marketing strategies, and you’ll be well on your way to generating more qualified leads than ever while optimizing your operation.


 Academy